What is Chande Momentum Oscillator
Chande Momentum Oscillator (CMO) is a non -standard oscillator, with which you can predict a speedy U -turn on the market. The unusual indicator lies in the fact that, unlike RSI or Stochastic, it does not change in the range from 0 to 100, but from -100 to 100. This is largely due to a non -standard approach to trading the creator of the indicator, who preferred complex mathematical surveys.
The creator of the indicator
For the first time CMO was represented In the 1994 book The New Technical Trader: Boost Your Profit by Pluging Into the Latest Indicators (“New Technical Analyst: Increase your profit using the latest indicators”). Its author was the American trader and Asset of Indian descent Tusar Chande. It was he who proposed a non -standard methodology for evaluating price fluctuations.
The calculation of the indicator
The main link for calculating the CHANDE MOMENTUM Oscillator is closing prices. The algorithm is as follows:
-
the calculation period is selected;
-
They are considered every two candles that go one after another at a given period of time;
-
If the closing price of the subsequent day is greater than the previous one, then it is added to a positive change; if less – to the negative;
-
The ratio of the difference in positive and negative changes to their sum is calculated, after which the result is 100%multiplied.
Thus, the formula for calculating CMO takes the form:
CMO = (Sh-SL)/(Sh+SL)*100%
Where:
-
CMO – CHANDE MOMENTUM OSCILLALALATOR;
-
SH – a positive change (the sum of the plus differences of each next candle relative to the previous one);
-
SL is a negative change (the sum of the minus differences in each next candle relative to the previous one in the module).
However, at present, manually calculation is not necessary – on each modern trading platform it is carried out automatically.
Signals for trading
Chande Momentum Oscillator gives three main trading signals: determining the zones of overwhelming and resellibility, intersection with a zero line and divergence.
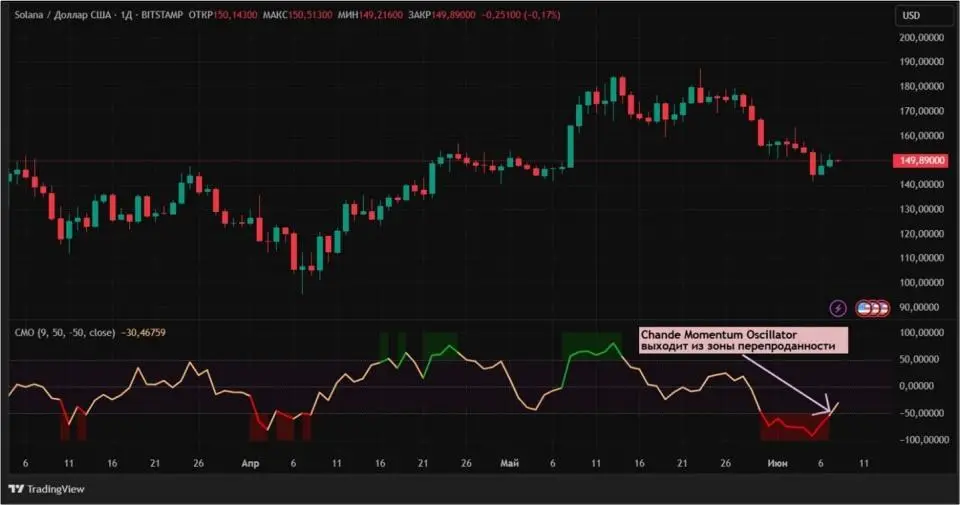
Tushar Chande determined the zone of overwhelming and resellibility when crossing the values of 50 and −50 with an indicator of values. In real conditions, traders can change these values for those that, in their opinion, work better on a specific tool. The signal interpretation is extremely simple: if the indicator has come out of the resale zone, then it is worth buying, and if you sell it from the overwhelming area.
As an example, take the SOLANA schedule. Since June, CMO has entered the respirit zone on the daily schedule. Throughout the week he stayed there until he left it on June 8, which gave a signal for purchases.

Source: TradingView.com
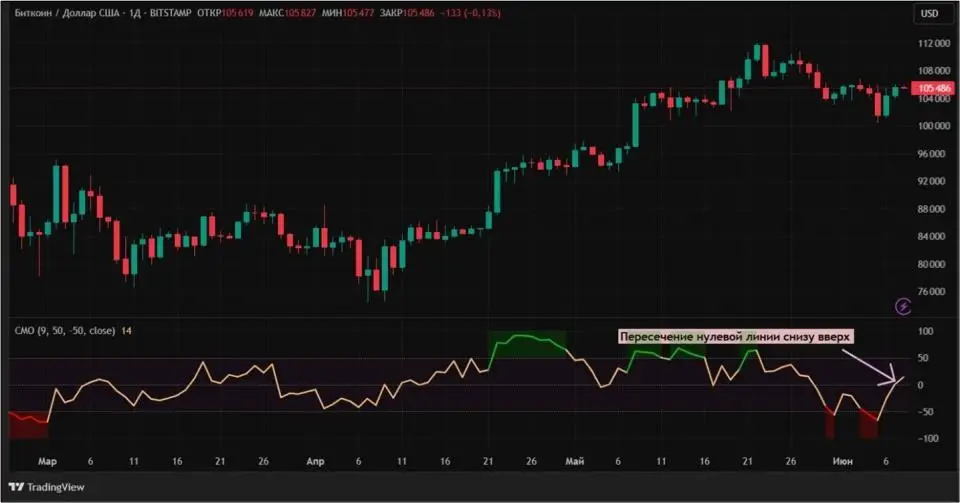
The intersection of the zero line is another classic signal for oscillators. If it occurs from the bottom up, then you should think about purchases, and if from top to bottom, then about sales. For example, on the daily schedule of Bitcoin, Chande Momentum Oscillator crossed the zero line on June 8, which is a bull signal. Thus, traders using this trading indicator can consider shopping opportunities.

Source: TradingView.com
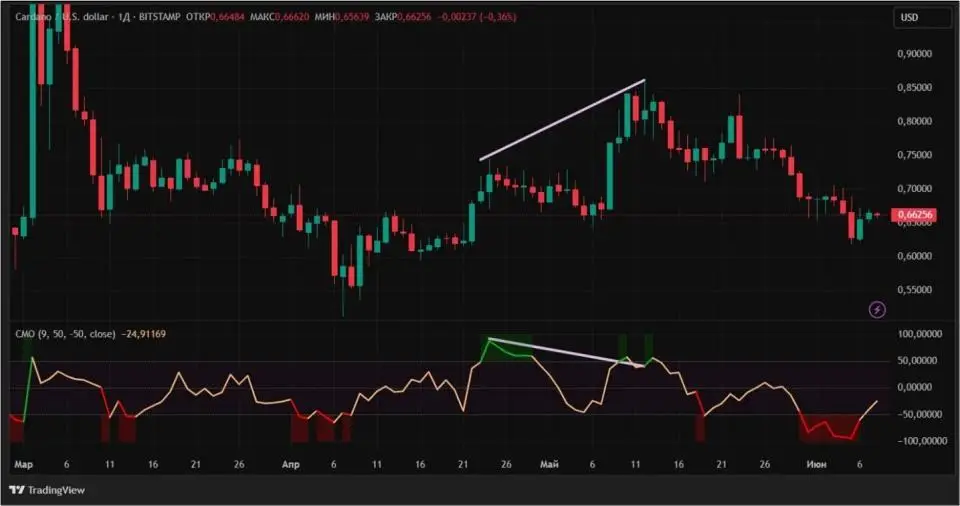
Divergence is a discrepancy between the values of the price and the indicator. There are two situations here. First: if the price shows a new maximum, but there is no indicator, then this is a bear divergence and it is worth selling. Second: if the price minimum is not accompanied by a lower CMO value, then this bull divergence is worth buying.
In terms of price discrepancies, the situation that has developed on the daily Cardano schedule in the spring of 2025 is interesting. On April 24, cryptocurrency reached the price of $ 0.745, which was accompanied by an indicator growth to 87.6. On May 12, Cardano updated his value peak, bargaining at $ 0.86. But Chande Momentum Oscillator showed the value of 41. Thus, a bear’s divergence has developed in the instrument. It is not surprising that soon Cardano moved to a decrease. In the image below, you can see the divergence of the price and indicator in the form of violet multidirectional lines.

Source: TradingView.com
Which oscillator is better to use
It is impossible to say with 100% confidence that one indicator is better than another. Economic reality is not stable, so it is better to use Chande Momentum Oscillator somewhere, in other cases RSI, and in the third-Stochastic. At the same time, in each case, it is necessary to set up the oscillators to specific crypto assets. You should not rely solely on the data of the developers of indicators, since for the most part they were characteristic of the period of their creation. In the same 1994, when CMO was described, cryptocurrencies were not yet in sight.
Conclusion
Chande Momentum Oscillator is another indicator that allows you to determine the dominant impulse on the crypto. The effectiveness of its application depends on the specific trading system that the trader uses, as well as on the chosen crypto active.
This material and information in it is not an individual or other other investment recommendation. The view of the editorial office may not coincide with the opinions of analytical portals and experts.
Source: Bits
I am an experienced journalist, writer, and editor with a passion for finance and business news. I have been working in the journalism field for over 6 years, covering a variety of topics from finance to technology. As an author at World Stock Market, I specialize in finance business-related topics.


