ADX (Average Directional Movement Index) shows the strength of the trend that has developed at a certain moment in a particular cryptocurrency. At the same time, ADX itself does not give an idea of the direction of movement: growth or decline.
The indicator was developed by Welles Wilder in the late 1970s. At that time, cryptocurrencies did not exist yet, so the author studied commodity markets. However, as the decades passed, ADX began to be used to analyze any market.
ADX Calculation
In most trading programs and services, you don’t need to calculate anything manually, it’s done automatically. The calculation will be useful only for general understanding, as well as for those who want to check the machine arithmetic.
ADX is based on another indicator — DMI (Directional Movement Index). It consists of two lines: +DI and -DM. Before calculating them, we will calculate the absolute positive (+DM) and absolute negative (-DM) price movement:
-
+DM = current maximum price – previous maximum price;
-
-DM = previous price minimum – current price minimum.
In this case, if we build a daily chart, we take the values for yesterday and today.
Next, you need to calculate TR (True range). To do this, select the maximum of the following values:
-
TR = current maximum – current minimum;
-
TR = current low – previous close;
-
TR = current high – previous close.
Now we calculate those same lines +DI and –DI:
-
+DI = EMA (+DM/TR);
-
-DI= EMA (-DM/TR).
Where EMA (Exponential moving average) is an exponential moving average.
We find ADX. It is the exponential average for 14 periods multiplied by 100 from the partial difference by the absolute value of the sum of the positive and negative direction indicators:
ADX = 100 *EMA14(|+DI- -DI|/ (+DI+- DI)).
Practical use
The ADX value varies from 0 to 100. The strength of the trend will depend on what value the indicator takes. In general, there are four options:
-
ADX in the range of 0-25 signals the absence of a trend, the market is in a sideways movement;
-
ADX between 25-50 – relatively weak trend;
-
ADX in the range of 50-75 indicates a strong trend;
-
ADX in the range of 75-100 – there is a very strong trend in the market.
The indicator rarely takes extreme values. In addition, ADX cannot be used to find entry points.
ADX Bitcoin and Ethereum
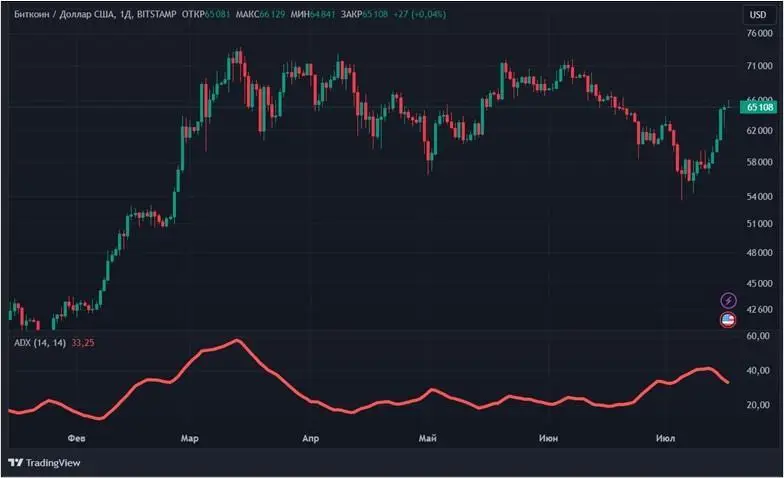
In Bitcoin for July 2024, according to ADX, a weak trend has emerged. This is explained by the indicator value of 33.25. Thus, we fall into the second range from 25 to 50.

Source: tradingview.com
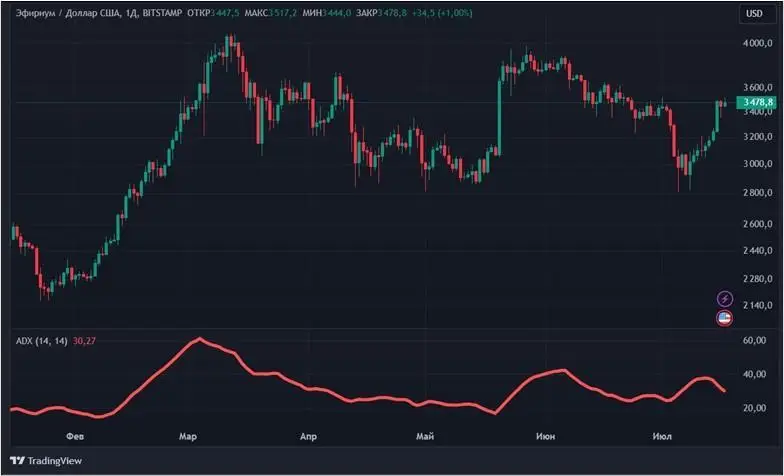
A similar situation is in the ether, where the ADX value is 30.27. This also corresponds to the second range.

Source: tradingview.com
But how can we understand what trend – bearish or bullish – has reigned in cryptocurrency if ADX does not provide such information? To do this, we need to look at the location of +DI and -DI.
Trend Definition
Let’s note right away that mutual intersection of lines can be observed infinitely many times, so confirmation from the ADX indicator is necessary, which will indicate the trend. In general, if +DI crosses -DI from bottom to top, then the trend should be ascending, in the opposite case – descending. For clarity, let’s consider several examples.
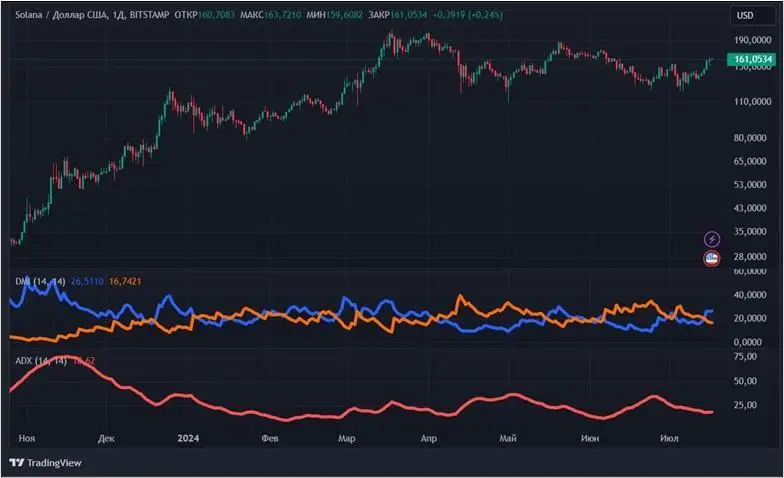
Let’s take the current situation in Solana. In order to see +DI and -DI, we use the DMI indicator, where the first one will be marked in blue, and the second one in orange. On the chart, we see that on July 14, the blue line crossed the orange line from bottom to top. Does this indicate a bullish trend? No. If we look at the ADX, it is 18. This indicates no trend in Solana.

Source: tradingview.com
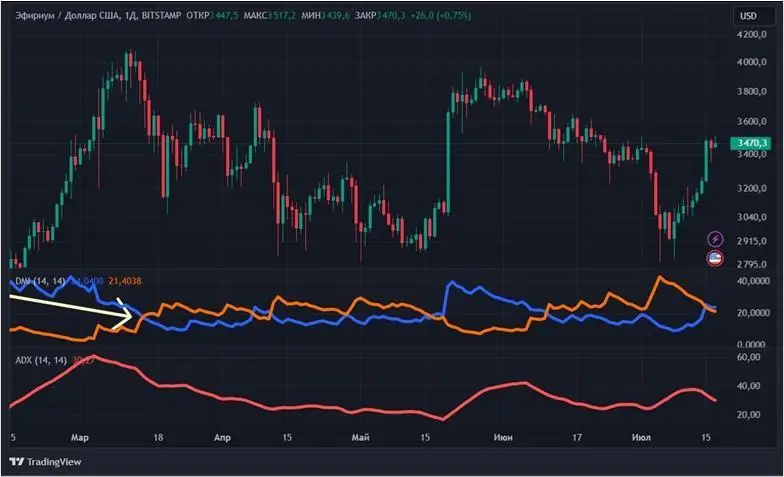
Another situation developed in the air in mid-March 2024. The orange -DI crossed the blue +DI from bottom to top (marked with a yellow arrow), while the ADX was 46.5. Here it was already possible to talk about the established bearish trend, as there was confirmation from the average direction index.

Source: tradingview.com
ADX, +DI and -DI should only be used in conjunction with other technical analysis indicators. In addition, it is worth considering the fundamental factors that affect cryptocurrencies. Using only ADX in trading will lead to serious losses, since the indicator often gives false signals. The same can be said about +DI and -DI.
Conclusion
Thus, ADX is an indicator that shows the existence of a trend in cryptocurrency, but the tool does not provide information about its direction. ADX is available in most cryptocurrency trading services, where the calculation is automatic. The indicator value varies from 0 to 100.
Source: Bits
I am an experienced journalist, writer, and editor with a passion for finance and business news. I have been working in the journalism field for over 6 years, covering a variety of topics from finance to technology. As an author at World Stock Market, I specialize in finance business-related topics.


