
- The US dollar is firmly on the back foot following the release of a soft CPI.
- The Fed should no longer be concerned about the disinflationary path.
- The US Dollar Index falls further and heads towards 104.75.
The US Dollar (USD) is weakening steadily on Thursday after the US Consumer Price Index (CPI) for June revealed a substantial decline in inflation. Special comments for retail sales which contracted by even 0.1%, meaning that the American consumer is no longer willing to pay current prices for goods and prefers to wait for lower prices before making their purchases. Adding a softer figure for housing and rent, it seems that the Fed’s measures are starting to bear fruit.
On the economic front, the most important data for this Thursday has already been released, and the focus will now shift to Friday with the June Producer Price Index (PPI) numbers. In the meantime, markets will want to hear from Fed officials that these numbers are what they are looking for, and should trigger a more dovish response from the Fed. With less than two months remaining, the first rate cut for the US seems assured for September.
Daily Market Wrap-Up: Big Surprise
- Let us guide you through the main numbers that were released this Thursday:
- US CPI for June:
- The monthly headline CPI fell in contraction from +0.1% to -0.1% in June.
- The monthly core CPI decreased from 0.2% to 0.1%.
- The annual general CPI fell from 3.3% to 3.0%.
- The annual core CPI rose from 3.4% to 3.3%.
- Weekly jobless claims for the week of July 5:
- Initial claims fell slightly, from 239,000 to 222,000.
- Continuing claims increased from 1.856 million to 1.852 million.
- US CPI for June:
- At 15:30 GMT, Federal Reserve Bank of Atlanta President Raphael Bostic participates in a moderated conversation at the NCUA Diversity, Equity and Inclusion Summit in Minneapolis, United States.
- Equity markets are gearing up for the upcoming earnings season, which kicks off with results from Pepsico and Delta before the opening bell on Thursday. Stocks are generally in good spirits with solid gains in Asia and positive returns in Europe, while US futures are lagging a bit.
- The CME Fedwatch tool broadly supports a September rate cut despite recent comments from Fed officials. The odds now stand at 68.1% for a 25 basis point rate cut. A rate pause has a 28.6% probability, while a 50 basis point rate cut has a slim 3.3% chance.
- The US 10-year Treasury bond yield is trading at 4.19%, holding near the lowest level of the week.
US Dollar Index Technical Analysis: CPI below expectations
The US Dollar Index (DXY) faces a crucial moment with the release of the June US Consumer Price Index. This is the decisive moment for the prospects of a rate cut in September, with any hike breaking the disinflationary trajectory which would mean the September meeting is off the table. Markets are therefore expected to give a more significant probability to further easing of the DXY than to a stronger US Dollar.
On the upside, the 55-day simple moving average (SMA) at 105.14 remains the first resistance. If that level bounces back, 105.53 and 105.89 are the next pivotal levels nearby. The red downtrend line on the chart below around 106.23 and the April peak at 106.52 could come into play if the Dollar rallies substantially.
On the downside, the risk of a dive is increasing, with only the double support at 104.81, which is the confluence of the 100-day SMA and the green ascending trendline from December 2023, still in place. If that double layer gives way, the 200-day SMA at 104.41 is the guardian that should catch the DXY and prevent further declines. Further down, the correction could head to 104.00 as an initial stage.
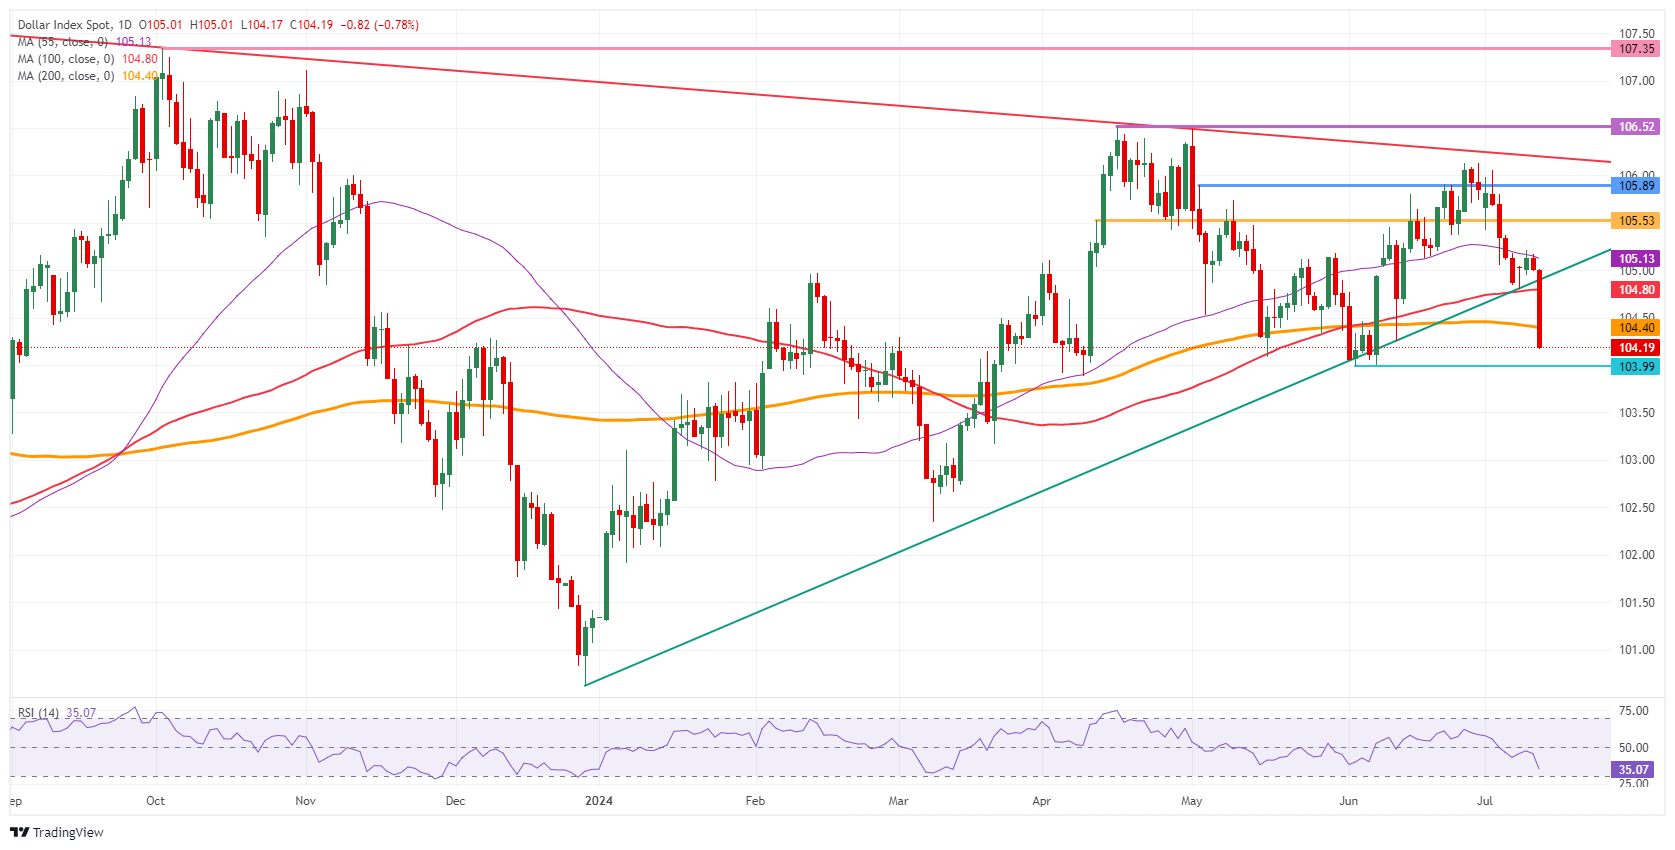
US Dollar Index: Daily Chart
Inflation FAQs
Inflation measures the rise in prices of a representative basket of goods and services. Headline inflation is usually expressed as a percentage change month-on-month and year-on-year. Core inflation excludes more volatile items such as food and fuel, which can fluctuate due to geopolitical and seasonal factors. Core inflation is the figure that economists focus on and is the target level for central banks, which are mandated to keep inflation at a manageable level, usually around 2%.
The Consumer Price Index (CPI) measures the change in prices of a basket of goods and services over a period of time. It is usually expressed as a percentage change month-on-month and year-on-year. The core CPI is the target for central banks as it excludes the volatility of food and fuel. When the core CPI exceeds 2%, interest rates typically rise, and vice versa when it falls below 2%. Since higher interest rates are positive for a currency, higher inflation usually translates into a stronger currency. The opposite is true when inflation falls.
Although it may seem counterintuitive, high inflation in a country drives up the value of its currency and vice versa in the case of lower inflation. This is because the central bank will typically raise interest rates to combat higher inflation, which attracts more global capital inflows from investors looking for a lucrative place to park their money.
Gold was once the go-to asset for investors during times of high inflation because it preserved its value, and while investors often still buy Gold for its safe haven properties during times of extreme market turmoil, this is not the case most of the time. This is because when inflation is high, central banks raise interest rates to combat it. Higher interest rates are negative for Gold because they increase the opportunity cost of holding Gold versus an interest-bearing asset or putting the money in a cash deposit account. Conversely, lower inflation tends to be positive for Gold as it lowers interest rates, making the shiny metal a more viable investment alternative.
Source: Fx Street
I am Joshua Winder, a senior-level journalist and editor at World Stock Market. I specialize in covering news related to the stock market and economic trends. With more than 8 years of experience in this field, I have become an expert in financial reporting.


