
- DXY changes direction sharply and moves above 109.00.
- The next upside barrier comes in at the year’s high near 110.80.
The DXY now challenges three-day highs at 109.56 after an unexpected change in sentiment among investors on the back of a higher-than-expected US CPI.
The short-term dollar bullish view holds as long as it trades above the 7-month support line near 106.30. That said, and in light of current price action, another move towards 20-year highs around 110.80 (Sep 6) should not be ruled out in the short term.
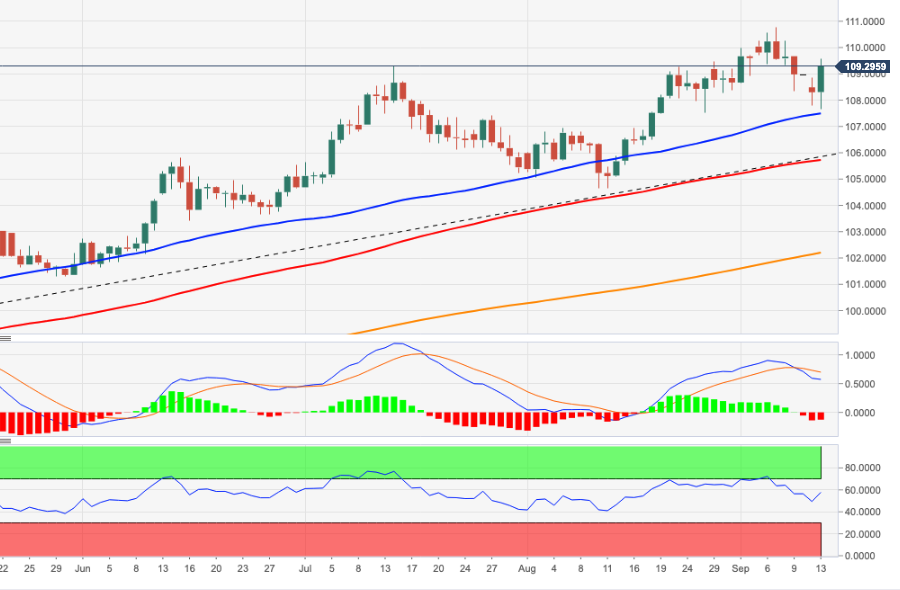
Looking at the long-term scenario, the constructive view on DXY remains unchanged as long as it is above the 200-day SMA at 101.46.
DXY Daily Chart
Source: Fx Street
With 6 years of experience, I bring to the table captivating and informative writing in the world news category. My expertise covers a range of industries, including tourism, technology, forex and stocks. From brief social media posts to in-depth articles, I am dedicated to creating compelling content for various platforms.

.jpg "All the sport that can be seen in this summer: here is the programming of Sky from engines to tennis")


