
- DXY resumes gains and approaches the 114.00 area.
- The 2022 high near 114.80 now appears on the horizon.
The US Dollar Index (DXY) It quickly leaves Thursday’s small dip behind and moves closer to the 114.00 area on Friday, or 3-week highs.
If the index breaks below the 114.00 area, then it could challenge the yearly high of 114.78 (Sep 28) before the round level of 115.00.
Prospects for additional dollar gains should not change as long as the index trades above the 8-month support line near 108.20. The proximity of the 100-day SMA also reinforces this region.
Longer term, DXY is expected to maintain its constructive stance as long as it is above the 200-day SMA at 103.70.
DXY daily chart
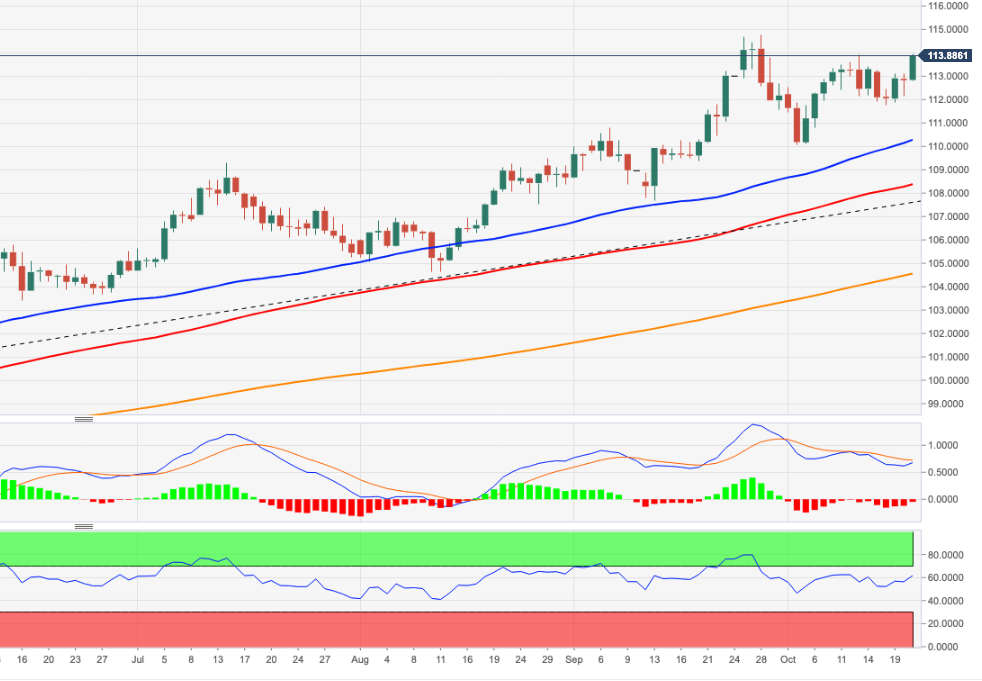
Source: Fx Street
With 6 years of experience, I bring to the table captivating and informative writing in the world news category. My expertise covers a range of industries, including tourism, technology, forex and stocks. From brief social media posts to in-depth articles, I am dedicated to creating compelling content for various platforms.


