
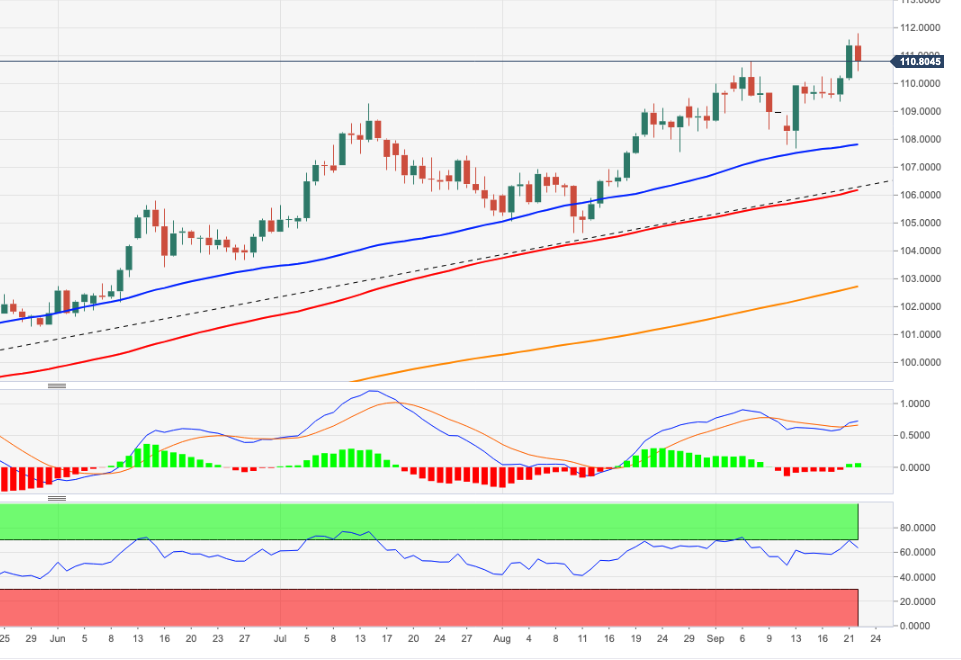
- DXY hits new all-time highs near 112.00 before losing momentum.
- More rises for the dollar are still within the possibilities in the short term.
The US Dollar Index (DXY) corrects lower after two consecutive daily advances, including new 20-year highs just below 112.00 on Thursday.
Prospects for additional dollar gains should hold as long as the index trades above the 7-month support line near 106.80. That being said, occasional bouts of weakness could be seen as buying opportunities with the immediate target being the 2022 high at 111.81 (Sep 22).
In the longer term, DXY is expected to maintain its constructive stance as long as it is above the 200 SMA at 101.95.
DXY day chart
Source: Fx Street
With 6 years of experience, I bring to the table captivating and informative writing in the world news category. My expertise covers a range of industries, including tourism, technology, forex and stocks. From brief social media posts to in-depth articles, I am dedicated to creating compelling content for various platforms.


