
- DXY breaks above 114.00 area and sets new cycle highs.
- Immediately on the upside is the hurdle at the 115.00 area.
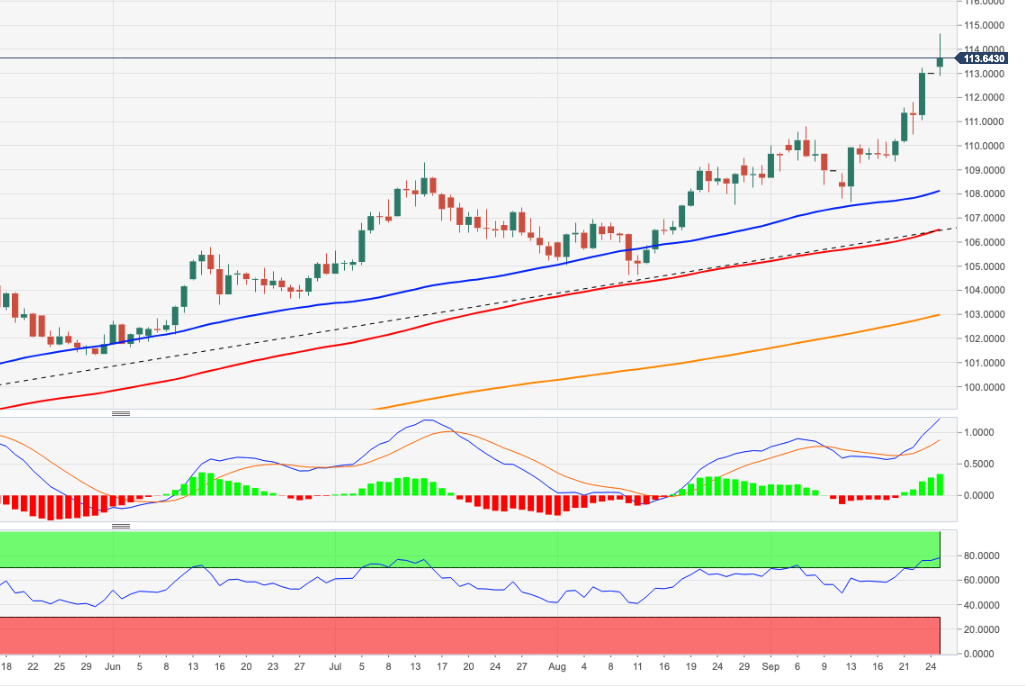
The US Dollar Index (DXY) adds to the ongoing recovery and breaks above the 114.00 barrier for the first time since May 2002.
Prospects for further dollar gains should remain unchanged as long as the index trades above the 7-month support line near 106.80. That said, occasional bouts of weakness could be seen as buying opportunities, with the immediate target now sitting around the 115.00 level, ahead of the May 2002 high of 115.32.
In the longer term, DXY is expected to maintain its constructive stance as long as it is above the 200 SMA at 102.12.
DXY day chart
Source: Fx Street
With 6 years of experience, I bring to the table captivating and informative writing in the world news category. My expertise covers a range of industries, including tourism, technology, forex and stocks. From brief social media posts to in-depth articles, I am dedicated to creating compelling content for various platforms.


