
- The Dow Jones plunged 700 points on Friday after NFP numbers soared in December.
- Market bets on Fed rate cuts tanked, rate traders now expect just one rate cut this year.
- Consumer sentiment and inflation expectations also rose, further impacting risk appetite.
The Dow Jones Industrial Average (DJIA) took a hit on Friday after investor sentiment soured due to a Non-Farm Payrolls (NFP) employment data report that showed a much higher hiring rate than expected. that most investors anticipated. The results of the University of Michigan (UoM) consumer survey also showed that the average US consumer expects more inflation rather than less in the next five years, further dampening risk appetite in stocks, as both strong job growth and high consumer inflation expectations bode poorly for further rate cuts from the Federal Reserve (Fed).
US NFP net job additions in December rose to 256,000, well above the expected 160,000, while the November figure saw a slight downward revision to 212,000. The UoM Consumer Sentiment Index fell to 73.2 in January, down from 74.0 the previous month and a steeper than expected drop to 73.8. The UoM 5-year Consumer Inflation Expectations also rose to 3.3%, a notable increase from 3.0% previously.
Markets are pivoting broadly away from expectations of Fed rate cuts in 2025 and dumping stocks as traders pile into the safe-haven USD. Major institutions like Bank of America and Goldman Sachs are publishing post-NFP research notes that broadly admit that everyone now expects even fewer Fed rate cuts in 2025 than before. According to the CME’s FedWatch tool, this sentiment is also being picked up by interest rate traders: rates markets are pricing in just a 25bp rate cut this year, and not before June at the earliest.
Dow Jones News
The Dow Jones is broadly lower on Friday, with fewer than ten stocks finding room in the green to close out the trading week. Losses were led by Travelers Companies (TRV), which plunged 4.3% on the day, falling to $232 per share. It was followed by Goldman Sachs (GS), which fell 3.5% and slid below $560 per share for the first time in almost a month.
Dow Jones Price Forecast
Friday’s post-NFP glut has pushed the Dow Jones within a stone’s throw of the 200-day EMA near 41,160. The Dow Jones Industrial Average is set to close below the 42,000 zone for the first time since early November, and the main stock index is more than 7% below the all-time highs of 45,065 set in December.
The continued decline in the Dow Jones will certainly raise new fears of a prolonged recession; However, the price action still remains north of the last major low, which was also supported by the 41,600 level. Despite a poor performance in December and more of the same so far in January, the Dow Jones is coming off a stellar bull run that saw the DJIA add nearly 20% from bottom to top throughout 2024.
Dow Jones Daily Chart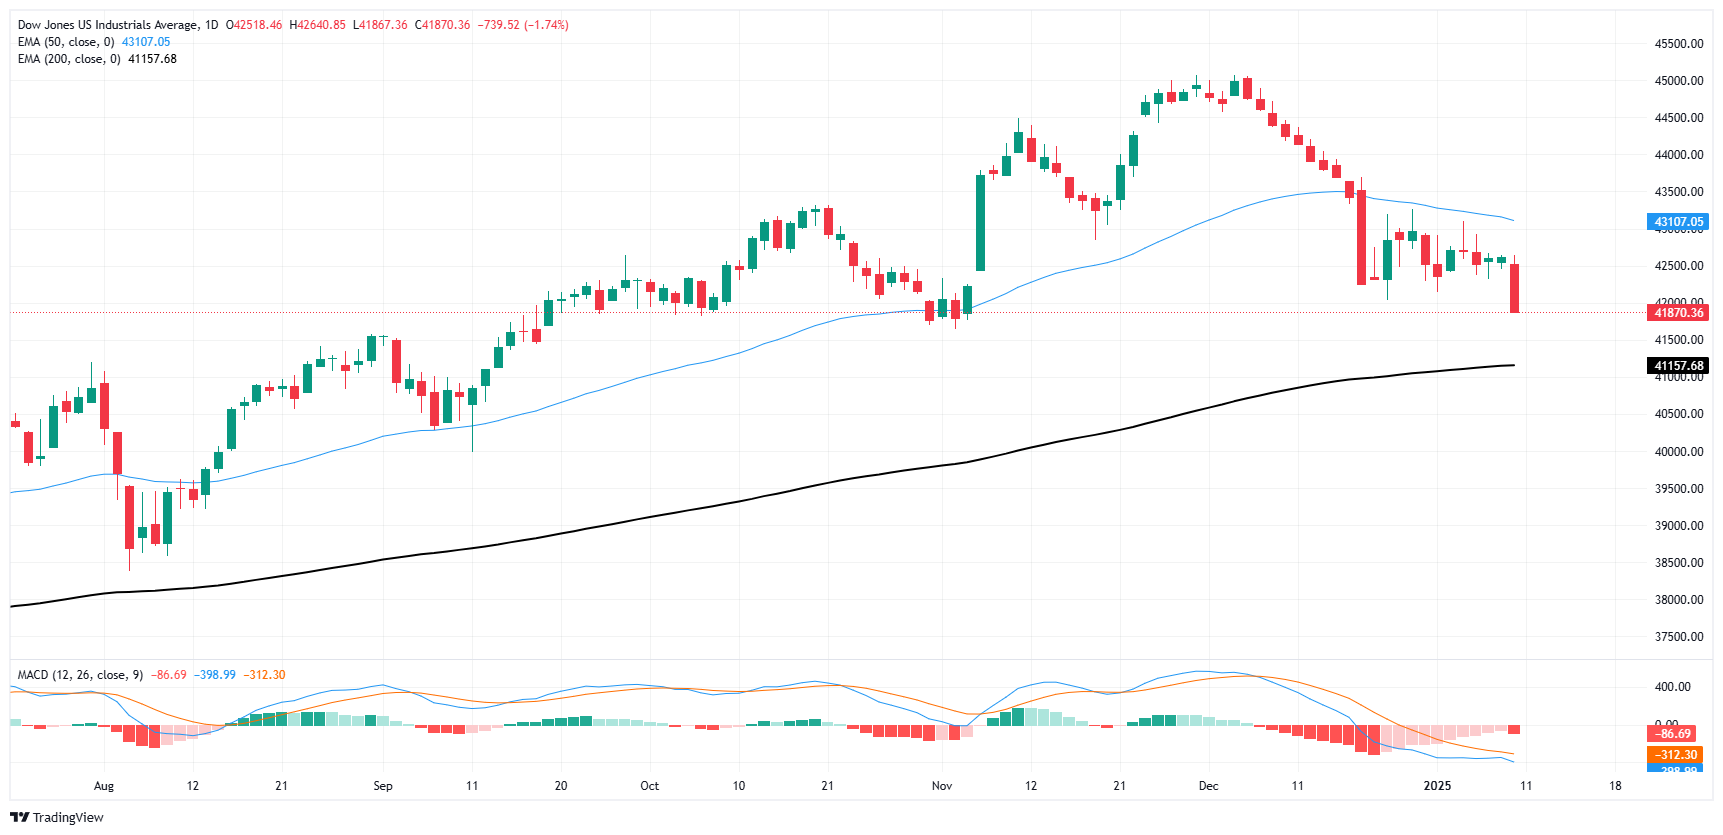
Dow Jones FAQs
The Dow Jones Industrial Average, one of the world’s oldest stock indices, is made up of the 30 most traded securities in the United States. The index is weighted by price rather than capitalization. It is calculated by adding the prices of the securities that comprise it and dividing them by a factor, currently 0.152. The index was founded by Charles Dow, also founder of the Wall Street Journal. In recent years it has been criticized for not being sufficiently representative, since it only follows 30 companies, unlike broader indices such as the S& P 500.
There are many factors that drive the Dow Jones Industrial Average (DJIA). The main one is the aggregate performance of its component companies, revealed in quarterly corporate earnings reports. US and global macroeconomic data also contribute, influencing investor sentiment. The level of interest rates, set by the Federal Reserve (Fed), also influences the DJIA, as it affects the cost of credit, on which many companies largely depend. Therefore, inflation can be a determining factor, as well as other parameters that influence the decisions of the Federal Reserve.
The Dow Theory is a method for identifying the main trend of the stock market developed by Charles Dow. A key step is to compare the direction of the Dow Jones Industrial Average (DJIA) and the Dow Jones Transportation Average (DJTA) and only follow trends where both are moving in the same direction. Volume is a confirmation criterion. The theory uses elements of maximum and minimum analysis. The Dow theory proposes three phases of the trend: accumulation, when the smart money begins to buy or sell; public participation, when the general public joins the trend; and distribution, when the smart money abandons the trend.
There are several ways to trade the DJIA. One of them is to use ETFs that allow investors to trade the DJIA as a single security, instead of having to buy shares of the 30 companies that comprise it. A prominent example is the SPDR Dow Jones Industrial Average ETF (DIA). Futures contracts on the DJIA allow traders to speculate on the future value of the index, and options provide the right, but not the obligation, to buy or sell the index at a predetermined price in the future. Mutual funds allow investors to purchase a portion of a diversified portfolio of DJIA securities, providing exposure to the global index.
Source: Fx Street
I am Joshua Winder, a senior-level journalist and editor at World Stock Market. I specialize in covering news related to the stock market and economic trends. With more than 8 years of experience in this field, I have become an expert in financial reporting.


")
