
- The Dow Jones index has rebounded from lows, returning to the session's opening level in afternoon trading.
- Market concerns over the Fed's “more hikes for longer” stance continue to weigh on risk appetite.
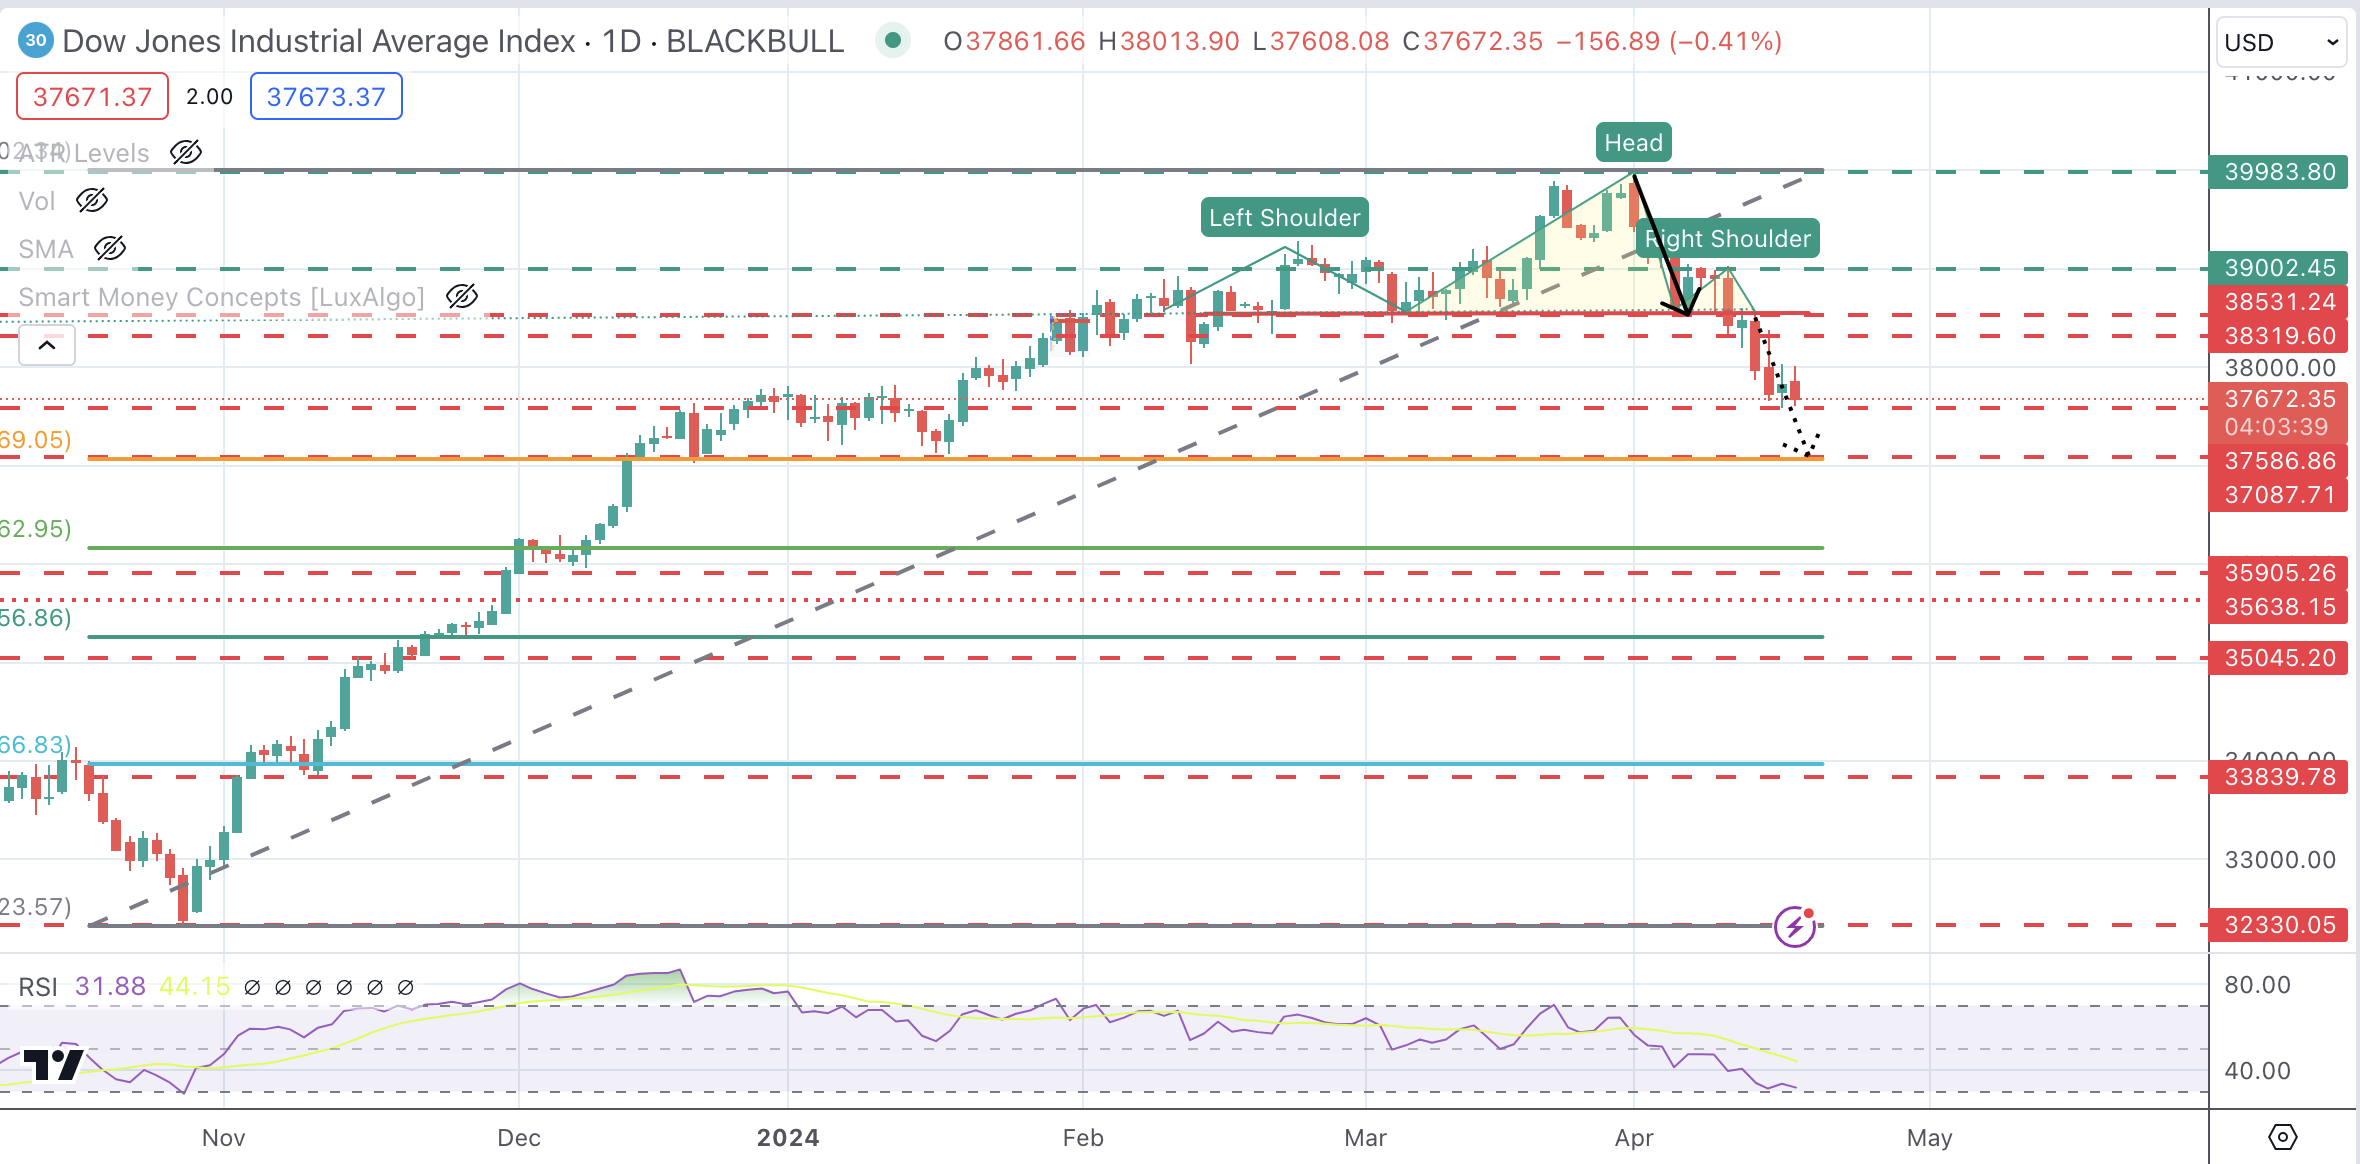
- The technical outlook remains bearish and the DJIA is retreating from the all-time highs reached in March.
The Dow Jones Industrial Average (DJIA) is trading up and down around Wednesday's opening level. Market sentiment remains fragile following Federal Reserve (Fed) Chairman Jerome Powell's hawkish comments on Tuesday, and a series of bearish quarterly results have weighed on market sentiment.
Powell on Tuesday noted the lack of progress on inflation and returned to the view of “higher for longer” monetary policy, which is acting to curb investors' risk appetite.
Quarterly earnings data disappointed on Wednesday, with Travelers Companies (TRV) reporting profits below estimates, while US Bancorp's (USB) net interest margin fell 14% in the first quarter. Elsewhere, news that Microsoft is avoiding a formal EU investigation into a $13 billion Open AI deal has calmed investor sentiment.
Wall Street's main indices remain in the red, but are recovering from session lows. The NASDAQ leads the losses, down 0.63% to 15,769, followed by the S&P 500, down 0.32% to 5,035, while the Dow Jones is trading flat at 37,790.
Dow Jones News
The technology sector performed the worst on Wednesday, down 1.1%, weighed down by the prospect of higher rates for longer. Industrialists follow on Wednesday with a decrease of 0.61%. On the positive side, public services rose 1.76%, while financial services revalued 0.34%.
Travelers Companies (TRV) plummets 7.61%, to $206.25, after disappointing quarterly results. Intel (INTC) follows with a drop of 1.6% to $35.67. United Health is the best performer, up 3.1% to $483.78, followed by Goldman Sachs (GS), up 1.92% to $404.5.
Dow Jones Technical Outlook
The DJIA index has reversed earlier gains and keeps an overall bearish outlook intact. The move below 38,560 has triggered a head and shoulders pattern pointing towards a steeper decline.
Immediate support lies at 37.586, followed by the measured target of the head and shoulder pattern, which lies at the mid-January low and the 38.6% Fibonacci retracement at 37.087. A bullish reaction could find resistance at the previous support of 38,531 ahead of the 39,000 region (order block).
Dow Jones Index Daily Chart
Frequently Asked Questions About the Dow Jones
What is the Dow Jones?
The Dow Jones Industrial Average, one of the world's oldest stock indices, is made up of the 30 most traded securities in the United States. The index is weighted by price rather than capitalization. It is calculated by adding the prices of the securities that comprise it and dividing them by a factor, currently 0.152. The index was founded by Charles Dow, also founder of the Wall Street Journal. In recent years it has been criticized for not being sufficiently representative, since it only follows 30 companies, unlike broader indices such as the S& P 500.
What factors influence the Dow Jones index?
There are many factors that drive the Dow Jones Industrial Average (DJIA). The main one is the aggregate performance of its component companies, revealed in quarterly corporate earnings reports. US and global macroeconomic data also contribute, influencing investor sentiment. The level of interest rates, set by the Federal Reserve (Fed), also influences the DJIA, as it affects the cost of credit, on which many companies largely depend. Therefore, inflation can be a determining factor, as well as other parameters that influence the decisions of the Federal Reserve.
What is the Dow theory?
The Dow Theory is a method for identifying the main trend of the stock market developed by Charles Dow. A key step is to compare the direction of the Dow Jones Industrial Average (DJIA) and the Dow Jones Transportation Average (DJTA) and only follow trends where they are both moving in the same direction. Volume is a confirmation criterion. The theory uses elements of maximum and minimum analysis. The Dow theory proposes three phases of the trend: accumulation, when the smart money begins to buy or sell; public participation, when the general public joins the trend; and distribution, when the smart money abandons the trend.
How can I trade with the DJIA?
There are several ways to trade the DJIA. One of them is to use ETFs that allow investors to trade the DJIA as a single security, instead of having to buy shares of the 30 companies that comprise it. A prominent example is the SPDR Dow Jones Industrial Average ETF (DIA). Futures contracts on the DJIA allow traders to speculate on the future value of the index, and options provide the right, but not the obligation, to buy or sell the index at a predetermined price in the future. Mutual funds allow investors to purchase a portion of a diversified portfolio of DJIA securities, providing exposure to the global index.
Source: Fx Street
I am Joshua Winder, a senior-level journalist and editor at World Stock Market. I specialize in covering news related to the stock market and economic trends. With more than 8 years of experience in this field, I have become an expert in financial reporting.


