
- The DXY index is under pressure after hitting fresh highs near 103.70.
- The 200-day SMA near 103.20 supports the dip for now.
He US dollar DXY index faces additional selling pressure and revisits the 103.15/103.10 region on Monday.
Despite Monday’s corrective move, the index maintains its bullish view well entrenched, with the immediate hurdle at the May high at 104.69 (May 31) ahead of the 2023 high at 105.88 (March 8).
It should be noted that this area of monthly highs seems bolstered by the proximity of the key 200-day SMA, today at 103.18.
From a broader perspective, a convincing break of the 200-day SMA should shift the outlook to a more constructive one.
DXY Index Daily Chart
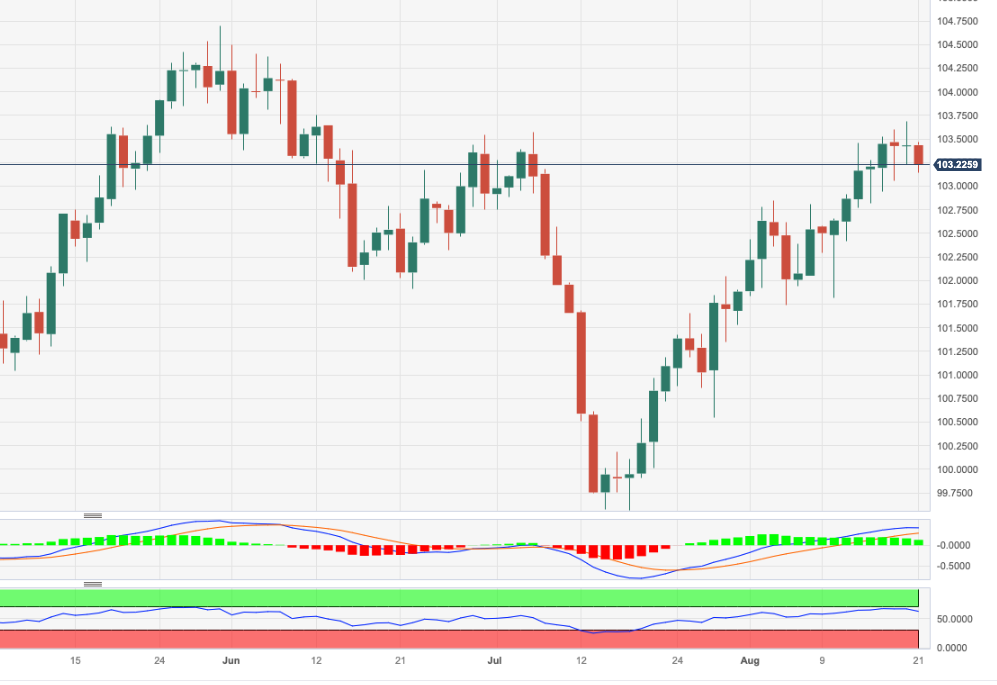
Source: Fx Street
I am Joshua Winder, a senior-level journalist and editor at World Stock Market. I specialize in covering news related to the stock market and economic trends. With more than 8 years of experience in this field, I have become an expert in financial reporting.


