
- DXY is under some pressure after Tuesday’s strong gains.
- A break of the 106.00 zone would expose the index to more losses.
The US Dollar Index (DXY) gives back part of the weekly advance and returns to the lower area of 107.00 on Wednesday.
It looks like there is strong containment at the 106.00 area at the moment, while the next barrier to the upside is not in sight before the 2022 high near 109.40 (14 Jul). Further dollar weakness could drag the index to the post-FOMC high of 105.78 (June 15).
Despite the current downtrend, the short-term outlook for DXY is seen as constructive as long as it is above the 5-month support line near 103.80.
Also, the broader bullish view holds as long as it is above the 200 SMA at 99.31.
DXY day chart
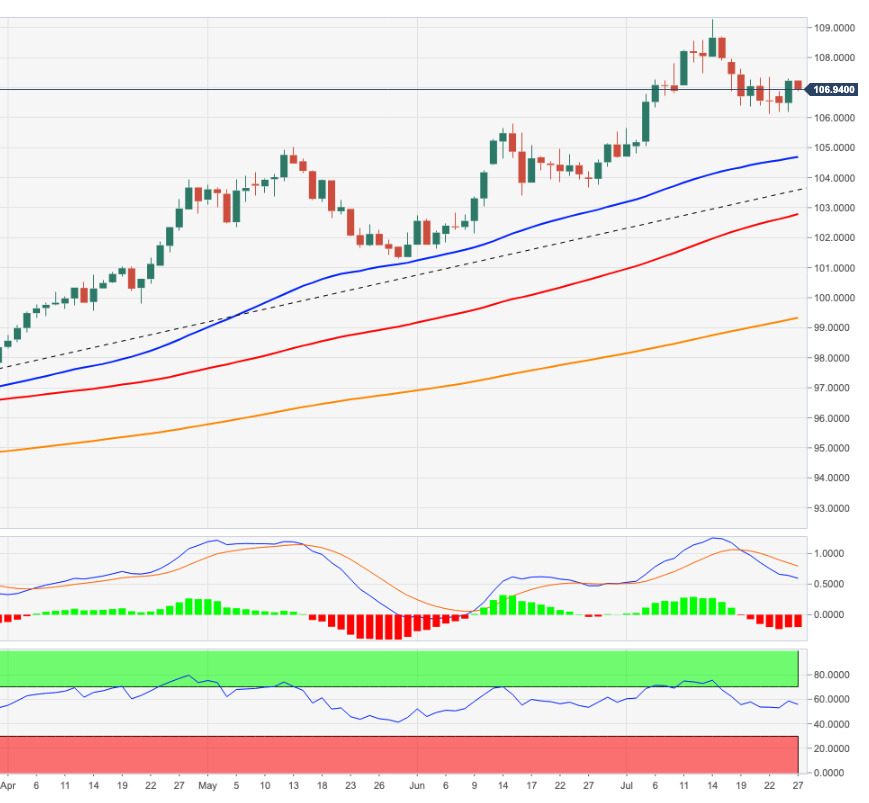
Source: Fx Street
With 6 years of experience, I bring to the table captivating and informative writing in the world news category. My expertise covers a range of industries, including tourism, technology, forex and stocks. From brief social media posts to in-depth articles, I am dedicated to creating compelling content for various platforms.


