
- The DXY breaks below the 106.00 support to mark new multi-month lows.
- Immediately to the downside now appears the 200-day SMA.
The dollar index (DXY) quickly fades Monday’s rally and returns to focus on dips, breaking below the 106.00 area for the first time since mid-August.
If the selling bias picks up pace, the index could go towards the critical 200-day SMA today at 104.89.
Below this zone, the outlook for the dollar should turn negative.
DXY day chart
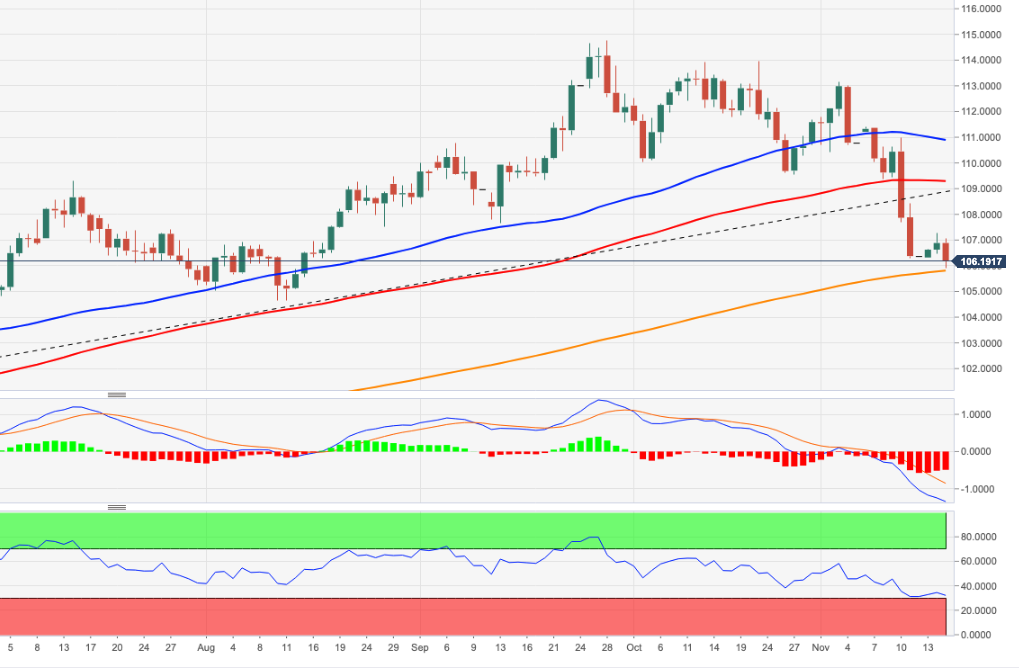
Source: Fx Street
I am Joshua Winder, a senior-level journalist and editor at World Stock Market. I specialize in covering news related to the stock market and economic trends. With more than 8 years of experience in this field, I have become an expert in financial reporting.


