
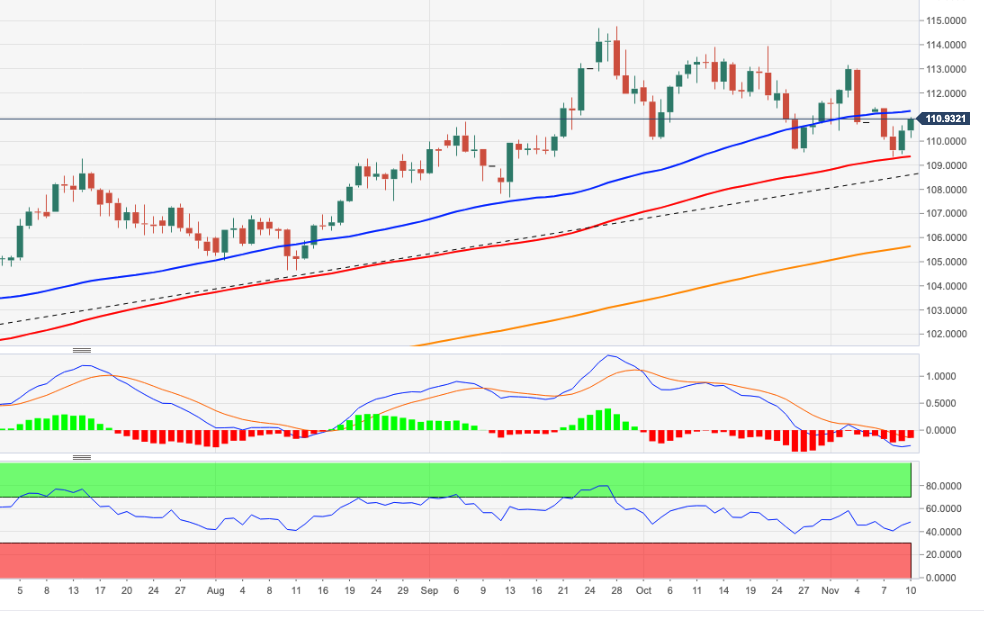
- DXY bounces higher and flirts with 111.00.
- The 55 day moving average looks like the next target near 111.10.
The Dollar Index (DXY) adds to buying interest on Wednesday and trades just a few points off the key 111.00 mark on Thursday.
An extension of the recovery now faces the immediate hurdle of the intermediate 55-day Simple Moving Average (SMA) at 111.08. If the index manages to break out of this level, then the next significant target is expected at the so far November high at 113.14 (3 Nov).
Longer term, DXY is expected to maintain its constructive stance as long as it is above the 200-day SMA at 104.74.
DXY day chart
Source: Fx Street
With 6 years of experience, I bring to the table captivating and informative writing in the world news category. My expertise covers a range of industries, including tourism, technology, forex and stocks. From brief social media posts to in-depth articles, I am dedicated to creating compelling content for various platforms.


