
- DXY is still navigating the upper end of the range, just below 110.00.
- If it continues to rise, it could see a revisit of the decades high above 110.00.
The Dollar Index (DXY) trades with modest gains in the 109.70/80 band on Tuesday.
The short-term bullish view on the dollar remains firm for now and underpinned by the 7-month support line today around 105.80.
Still on the upside, breaking the recent high at 110.27 (Sep 5) could face the next barrier at the weekly highs of 111.90 (June 6, 2002) and 113.35 (May 24, 2002).
Regarding the long-term scenario, the bullish view of the dollar remains while it is above the 200-day simple moving average (SMA) at 101.13.
However, the current overbought conditions in the index could trigger a downward correction, which could be seen as a buying opportunity.
DXY day chart
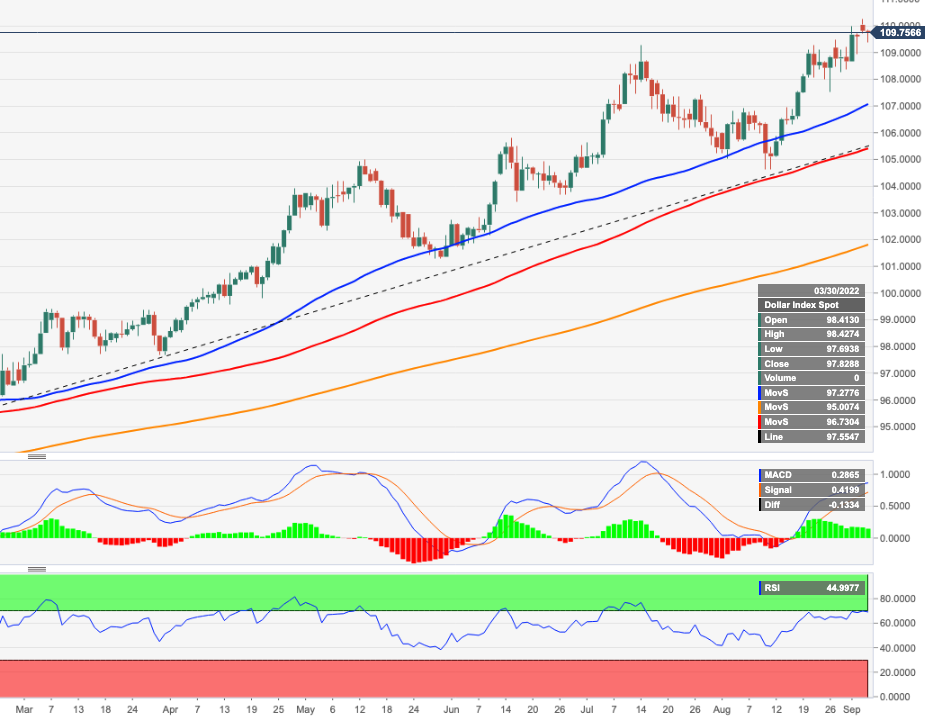
Source: Fx Street
With 6 years of experience, I bring to the table captivating and informative writing in the world news category. My expertise covers a range of industries, including tourism, technology, forex and stocks. From brief social media posts to in-depth articles, I am dedicated to creating compelling content for various platforms.


