
- DXY regains traction and reverses two consecutive daily declines.
- The ongoing bounce should head towards the 114.00 area in the short term.
The Dollar Index (DXY) recovers the area above 112.00 on Monday after two losing sessions in a row.
The continuation of the recovery should return to focus on the recent highs near 114.00. Breaking above this level should put a visit to the 2022 high at 114.78 (September 28) back on the short-term horizon.
The prospects for further dollar gains should not change as long as the index trades above the 8-month support line near 108.20, an area that coincides with the 100-day SMA.
In the longer term, DXY is expected to maintain its constructive stance as long as it is above the 200-day SMA at 103.78.
DXY day chart
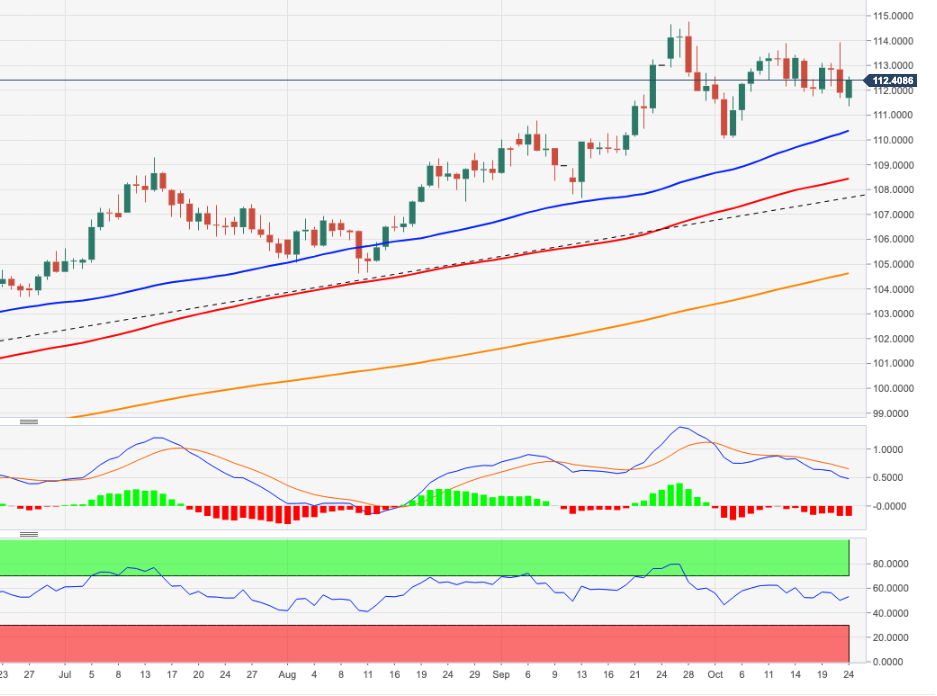
Source: Fx Street
With 6 years of experience, I bring to the table captivating and informative writing in the world news category. My expertise covers a range of industries, including tourism, technology, forex and stocks. From brief social media posts to in-depth articles, I am dedicated to creating compelling content for various platforms.


