
- DXY attempts a corrective bounce after flirting with 105.00.
- Below is the 55-day moving average at 104.79 to the downside.
The US Dollar Index (DXY) manages to reverse the initial drop to the limits of the 105.00 area on Tuesday.
Despite the ongoing rebound, the index remains under pressure after breaking out of a multi-session consolidation ahead of the FOMC.
That said, a further decline is still possible and a break below the 105.00 level should leave the door open for a likely visit to the 6-month support line around 104.00.
As long as it is above the latter, the dollar’s constructive short-term outlook is expected to persist.
Also, the broader bullish view holds as long as it is above the 200-day SMA at 99.55.
DXY day chart
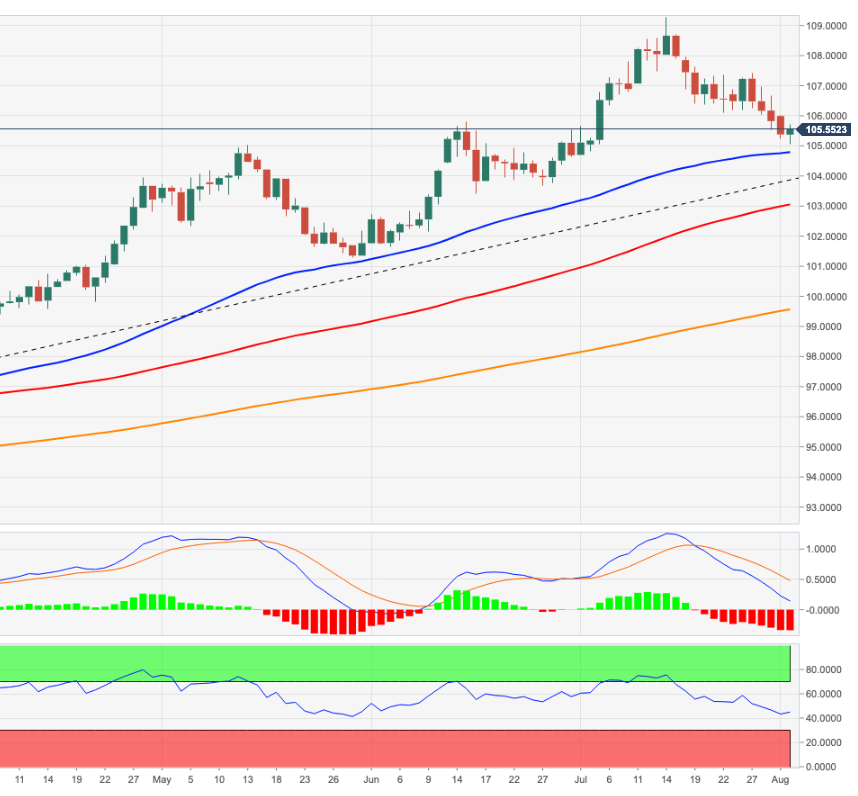
Source: Fx Street
With 6 years of experience, I bring to the table captivating and informative writing in the world news category. My expertise covers a range of industries, including tourism, technology, forex and stocks. From brief social media posts to in-depth articles, I am dedicated to creating compelling content for various platforms.


