
- The DXY extends Tuesday’s slide and returns below 102.00.
- A move below the January low at 101.77 exposes the index to further declines.
The US Dollar Index (DXY) is trading defensively and revisits the area below 102.00 amid intense selling pressure on Wednesday.
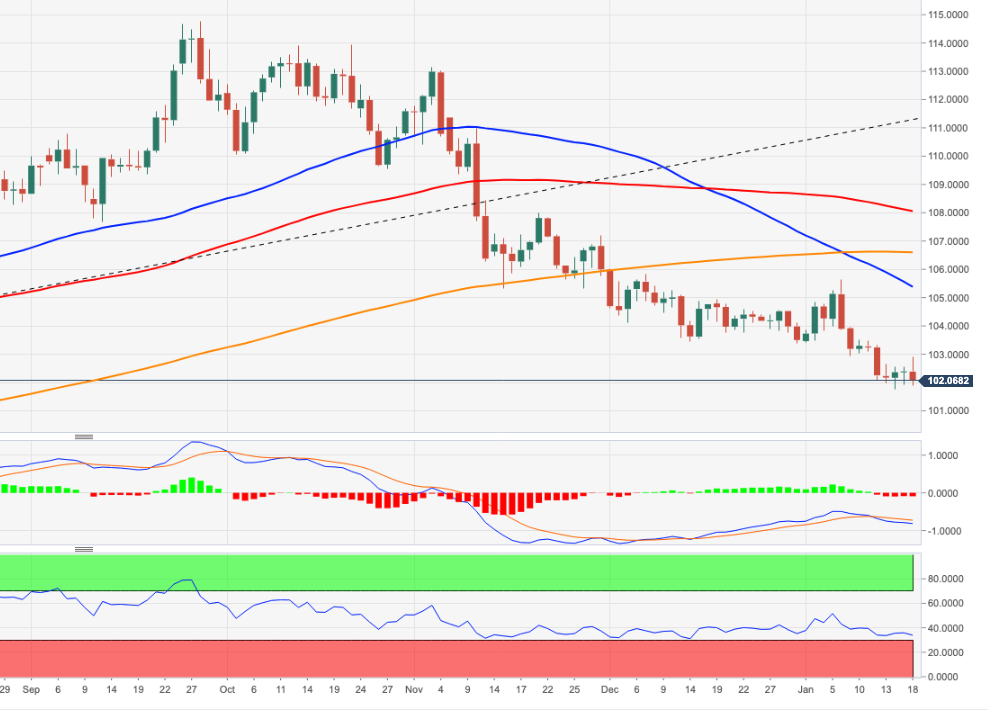
For now, continuation of the sideways trend seems like the name of the game for the dollar, at least in the short term. Should the bears regain control, the loss of the January low at 101.77 (Jan 16) should put a possible deeper fall back to the May 2022 low around 101.30 ( May 30) before the psychological level of 100.00.
Meanwhile, below the 200-day SMA at 106.42, the outlook for the index should remain negative.
DXY day chart
Source: Fx Street
I am Joshua Winder, a senior-level journalist and editor at World Stock Market. I specialize in covering news related to the stock market and economic trends. With more than 8 years of experience in this field, I have become an expert in financial reporting.


