
- DXY extends the rally and flirts with 107.00.
- Further up is the weekly high around 107.40.
The US Dollar Index (DXY) extends the rebound from recent lows and approaches the key barrier of the 107.00 zone on Tuesday.
The continuation of the bullish momentum could extend to the August high near 107.00 (Aug 5). Once surpassed, the index could try to face the subsequent high reached after the FOMC meeting at 107.42 (July 27).
In a broader scenario, the bullish view of the dollar remains above the 200-day simple moving average at 100.16.
DXY day chart
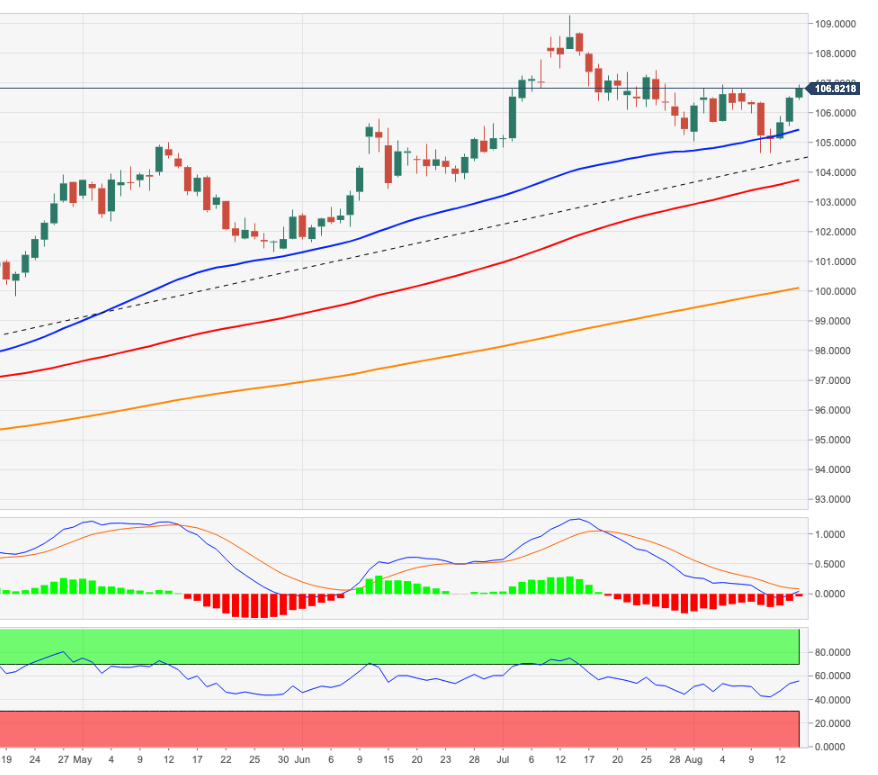
Source: Fx Street
With 6 years of experience, I bring to the table captivating and informative writing in the world news category. My expertise covers a range of industries, including tourism, technology, forex and stocks. From brief social media posts to in-depth articles, I am dedicated to creating compelling content for various platforms.


