
- DXY continues to rise and flirts with the 2022 high near 109.30.
- Further north comes the September 2002 high around 109.80.
The US Dollar Index (DXY) maintains the recovery and trades within striking distance of 2022 highs near 109.30 on Tuesday.
A continuation of the bullish momentum looks increasingly likely in the very short term. That said, beyond the 2022 high of 109.29 (July 14) the index could challenge the September 2002 high of 109.77 before the 110.00 level.
Meanwhile, if it remains above the six-month support line near 105.10, the index is expected to maintain the positive stance in the short term.
As for the long-term scenario, the bullish view of the dollar remains as long as it is above the 200-day simple moving average at 100.49.
DXY day chart
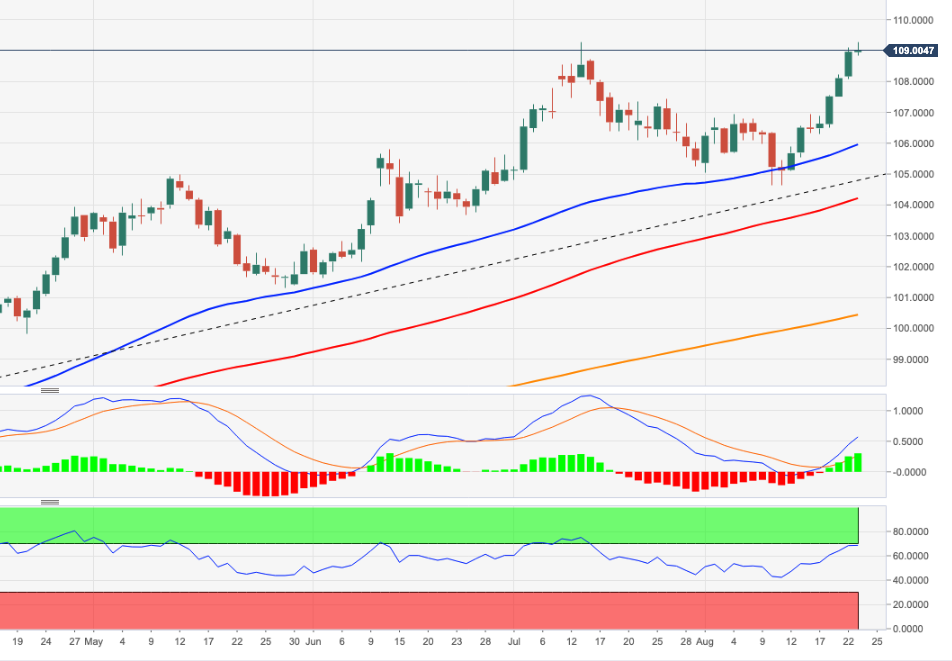
Source: Fx Street
With 6 years of experience, I bring to the table captivating and informative writing in the world news category. My expertise covers a range of industries, including tourism, technology, forex and stocks. From brief social media posts to in-depth articles, I am dedicated to creating compelling content for various platforms.


