
- Price action around the DXY does not show a clear direction on Tuesday.
- Persistent weakness should open the door for a drop to 101.30.
The US Dollar Index (DXY) is trading sideways near, and above 103.00 on Tuesday.
A drop below the January low so far at 102.94 (Jan 9) could lead to the May 2022 low around 101.30 (May 30) reappearing on the horizon ahead of the 100.00 psychological level.
In the meantime, if it remains below the 200 SMA at 106.35, the outlook for the index should continue to tilt to the downside.
DXY day chart
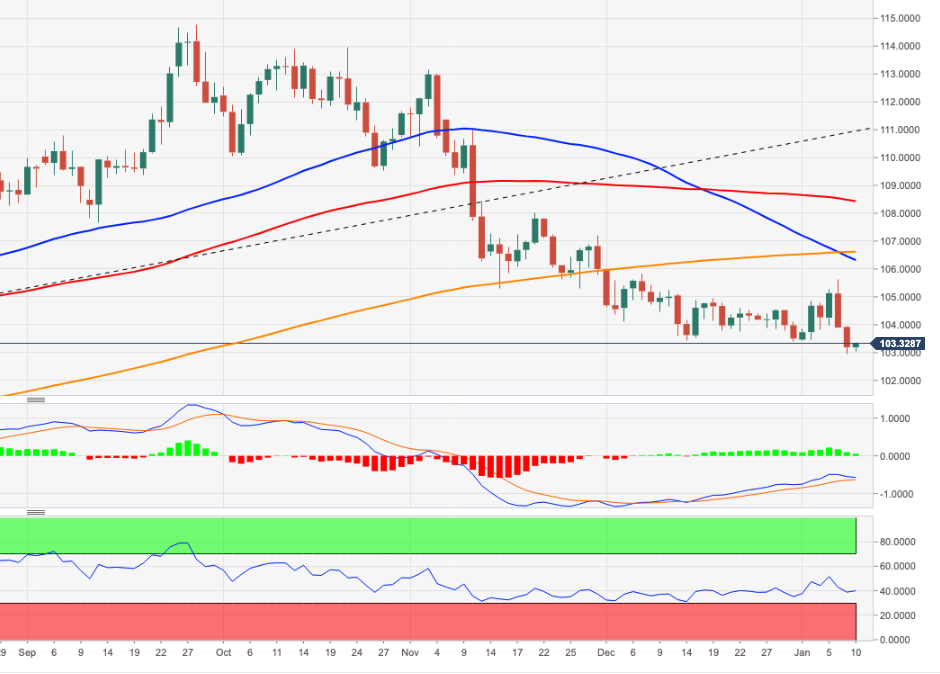
Source: Fx Street
I am Joshua Winder, a senior-level journalist and editor at World Stock Market. I specialize in covering news related to the stock market and economic trends. With more than 8 years of experience in this field, I have become an expert in financial reporting.


