
- The Index is teetering at the 104.00 low zone amid an unclear risk trend.
- The continuation of the downtrend could take the DXY to the 103.40 zone.
The Dollar Index (DXY) remains under pressure and, for now, manages to hold off dips just above the 104.00 zone on Monday.
Continued selling pressure could encourage the US dollar to accelerate losses and challenge the weekly low at 103.67 (Jun 27) before another weekly low at 103.41 (Jun 16).
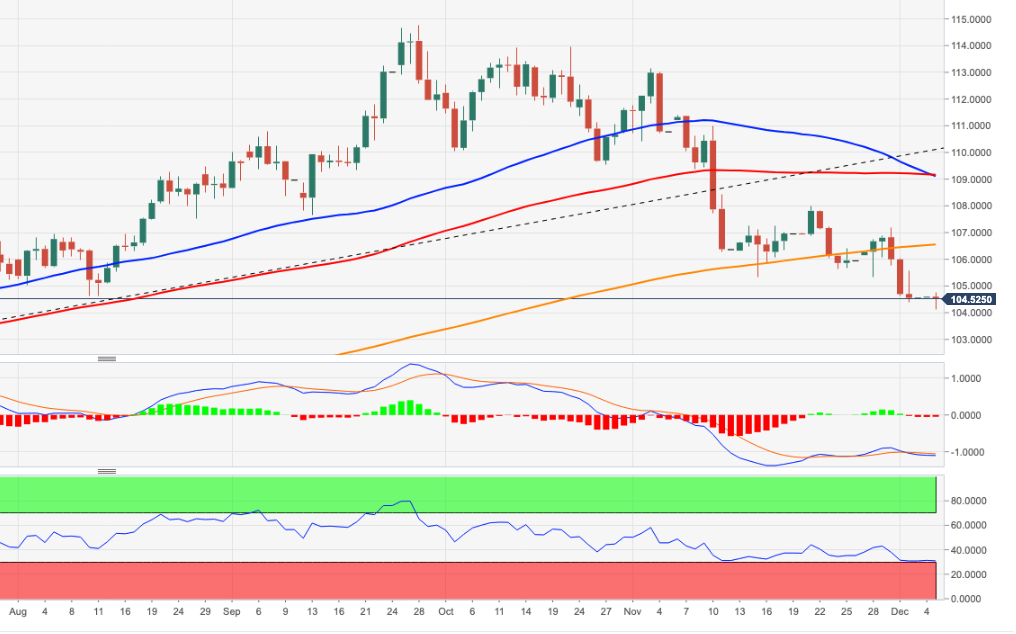
Below the 200 SMA at 105.59, the outlook for the dollar should remain negative.
DXY day chart
Source: Fx Street
I am Joshua Winder, a senior-level journalist and editor at World Stock Market. I specialize in covering news related to the stock market and economic trends. With more than 8 years of experience in this field, I have become an expert in financial reporting.


