
- DXY makes new cycle highs near 109.50 on Monday.
- If it continues to rise, it could revisit the September 2002 high at 109.77.
The US Dollar Index (DXY) extends the rally after Powell’s exposure in Jackson Hole to the 109.50 area, while recording new cycle highs.
In the short term, the index could continue to rise. Breaking above the 2022 high at 109.47 (Aug 29) should open the door to the September 2002 high at 109.77 before the round level of 110.00.
Meanwhile, if it remains above the 6-month support line around 105.40, the index is expected to maintain the positive stance in the short term.
As for the long-term scenario, the bullish view on the dollar remains as long as it is above the 200-day simple moving average at 100.74.
DXY day chart
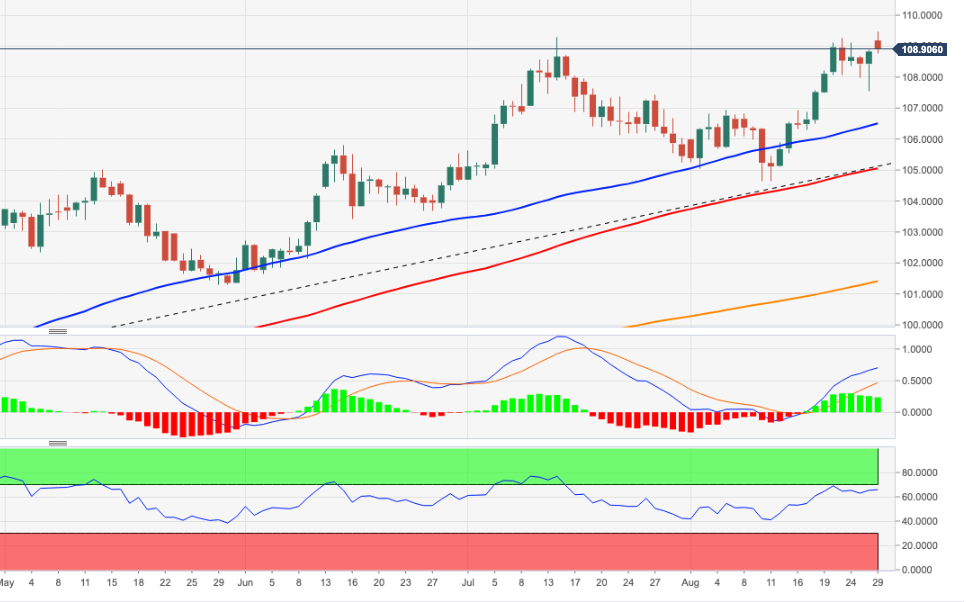
Source: Fx Street
With 6 years of experience, I bring to the table captivating and informative writing in the world news category. My expertise covers a range of industries, including tourism, technology, forex and stocks. From brief social media posts to in-depth articles, I am dedicated to creating compelling content for various platforms.


