
- The index loses more ground and falls back to minimums in several months.
- Further weakness could force the dollar to test the 103.40 zone.
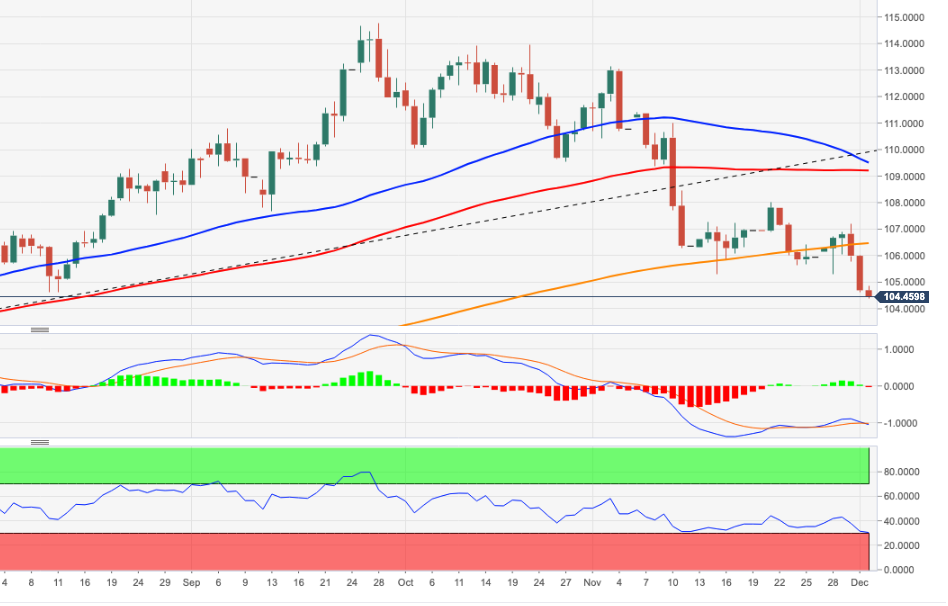
The dollar index (DXY) loses ground for the third session in a row and revisits the 104.30 area on Friday.
Continued selling pressure could lead the dollar to accelerate losses and challenge the weekly low at 103.67 (Jun 27) before another weekly low at 103.41 (Jun 16).
Below the 200-day SMA at 105.51, the outlook for the dollar should remain negative.
DXY day chart
Source: Fx Street
I am Joshua Winder, a senior-level journalist and editor at World Stock Market. I specialize in covering news related to the stock market and economic trends. With more than 8 years of experience in this field, I have become an expert in financial reporting.


 meeting for peace: “First step towards reconciliation”")
