
- The DXY extends Tuesday’s slide and loses 106.00 again.
- The next support to watch is the 200-day MA, near 105.00.
The dollar index (DXY) remains under pressure and holds trade in the low area around 106.00 mid-week.
If the selling trend picks up pace, the index could go to test the 200-day SMA today at 104.94. The loss of this important support area could put a fall back to the August low at 104.63 (Aug 10) on the radar again.
Below the 200-day SMA, the outlook for the dollar should turn negative.
DXY day chart
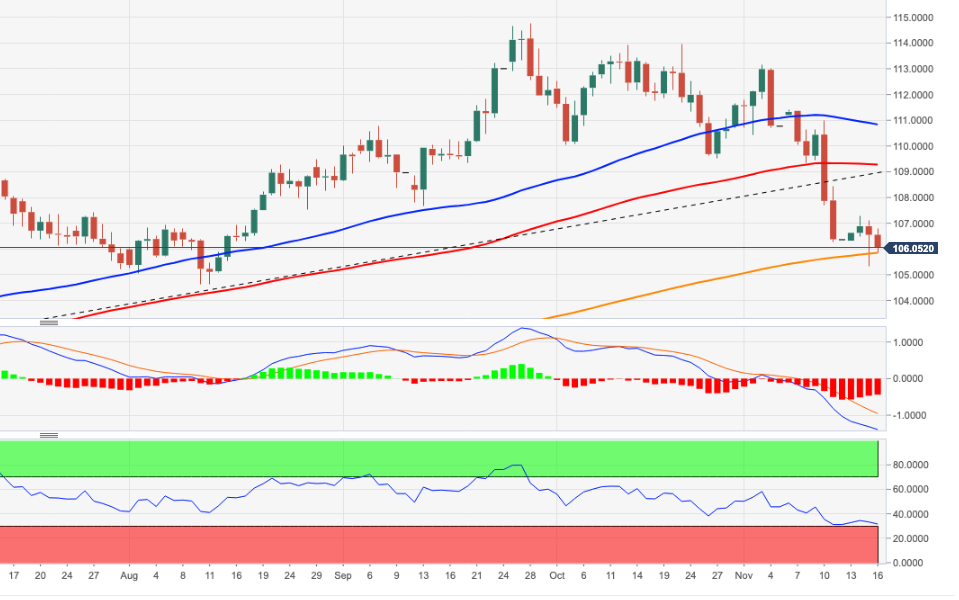
Source: Fx Street
I am Joshua Winder, a senior-level journalist and editor at World Stock Market. I specialize in covering news related to the stock market and economic trends. With more than 8 years of experience in this field, I have become an expert in financial reporting.


