
- DXY regains some poise after three daily pullbacks.
- The nine-month support line appears around 109.00.
The Dollar Index (DXY) buying interest picks up a bit and briefly tests the area beyond 110.00 on Wednesday.
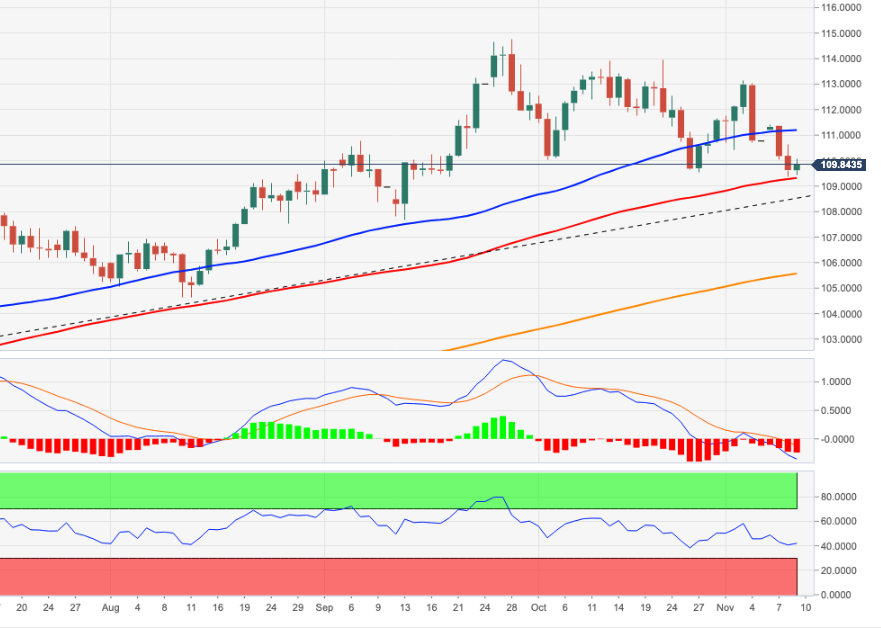
Further dollar weakness should not be ruled out despite the current bullish attempt. That said, the loss of the 9-month support near 109.00 carries the potential to magnify the decline and open the door for a further short-term pullback.
In the longer term, DXY is expected to maintain its constructive stance as long as it is above the 200 SMA at 104.66.
DXY day chart
Source: Fx Street
With 6 years of experience, I bring to the table captivating and informative writing in the world news category. My expertise covers a range of industries, including tourism, technology, forex and stocks. From brief social media posts to in-depth articles, I am dedicated to creating compelling content for various platforms.


