
- The DXY remains under pressure near the 103.00 zone.
- A break of the 102.90 area could trigger a steeper drop.
Price action around the dollar remains subdued and encourages the dollar index (DXY) to test the 103.00 support on Thursday.
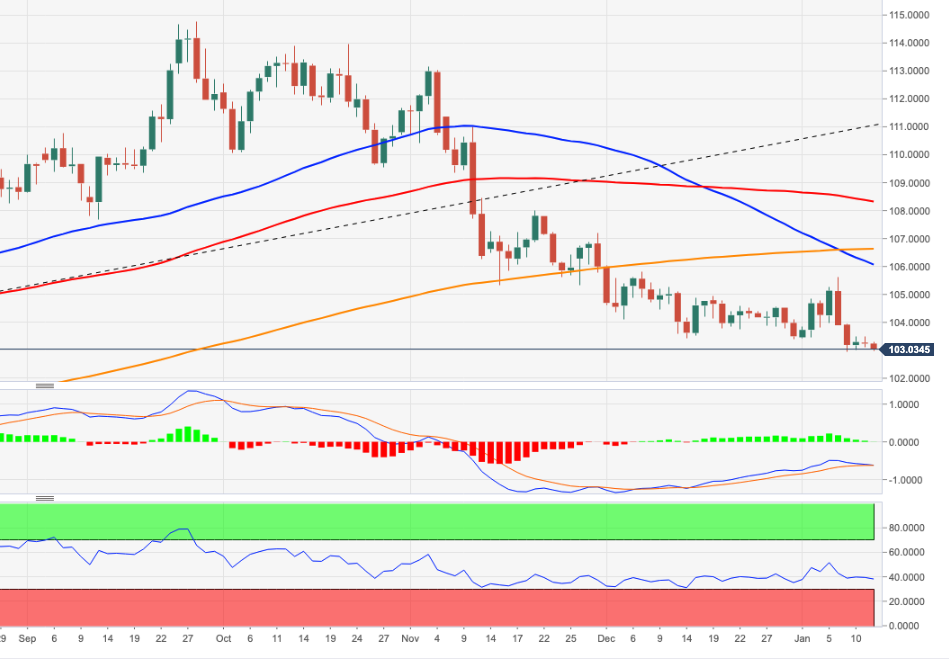
If the offered stance intensifies, the index could challenge the January low at 102.94 (Jan 9) in the near term, while a convincing break of this level could trigger a pullback to initially the May 2022 low around to 101.30 (May 30) ahead of the 100.00 psychological level.
Meanwhile, if it remains below the 200 SMA at 106.38, the outlook for the index should remain negative.
DXY day chart
Source: Fx Street
I am Joshua Winder, a senior-level journalist and editor at World Stock Market. I specialize in covering news related to the stock market and economic trends. With more than 8 years of experience in this field, I have become an expert in financial reporting.


