
- DXY remains under pressure well below 102.00.
- Immediately to the downside comes the 55-day moving average.
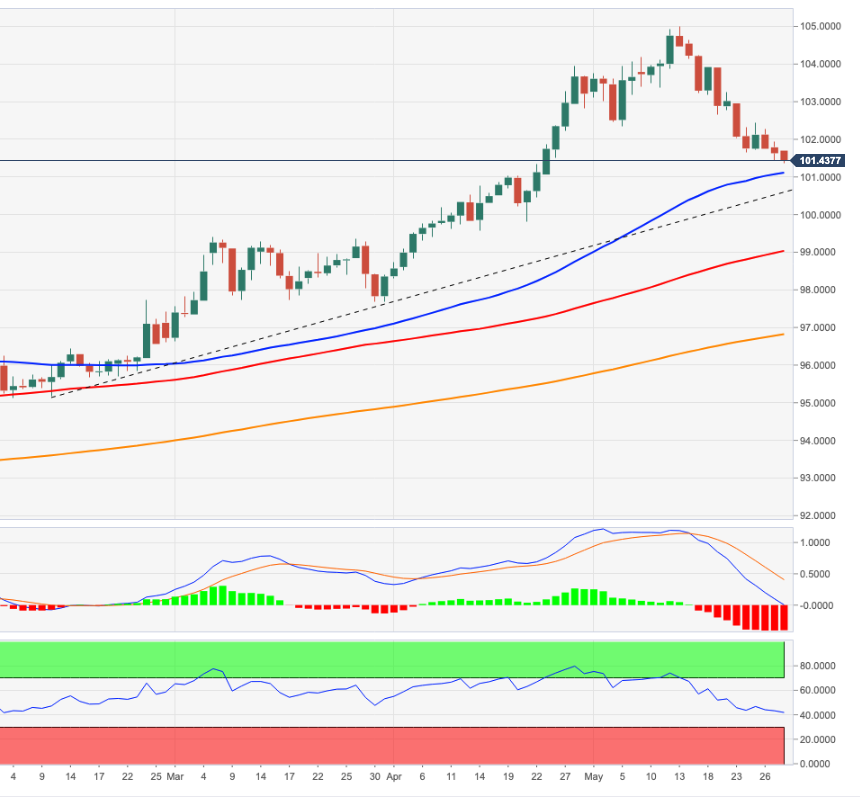
The US Dollar Index (DXY) accelerates losses and hits new multi-week lows in the 101.30 region on Monday.
DXY remains under pressure and further losses should not be ruled out at the moment. That said, further decline is expected to target the temporary 55-day simple moving average today at 101.10, ahead of the three-month line around 100.60.
Looking at the long term, the outlook for the dollar looks positive as long as it is above the 200 SMA at 96.80.
DXY day chart
Source: Fx Street
With 6 years of experience, I bring to the table captivating and informative writing in the world news category. My expertise covers a range of industries, including tourism, technology, forex and stocks. From brief social media posts to in-depth articles, I am dedicated to creating compelling content for various platforms.


