
- DXY extends bearish pressure and breaks 104.00.
- The next support comes in the 103.40 region.
The US Dollar Index (DXY) extends the lows at the beginning of the week and briefly visits the area below the 104.00 support on Tuesday.
Considering the ongoing price action, a further correction on the short-term time frame should not be ruled out. That said, another visit to the post-Fed meeting low at 103.41 (June 16) is expected to remain on the cards in the near term, ahead of the 55-day SMA at 102.53.
As long as the four-month line around 101.85 holds and keeps downsides limited, the short-term outlook for the index should remain constructive.
Looking at the long term, the outlook for the dollar looks bullish as long as it is above the 200-day simple moving average at 97.67.
DXY day chart
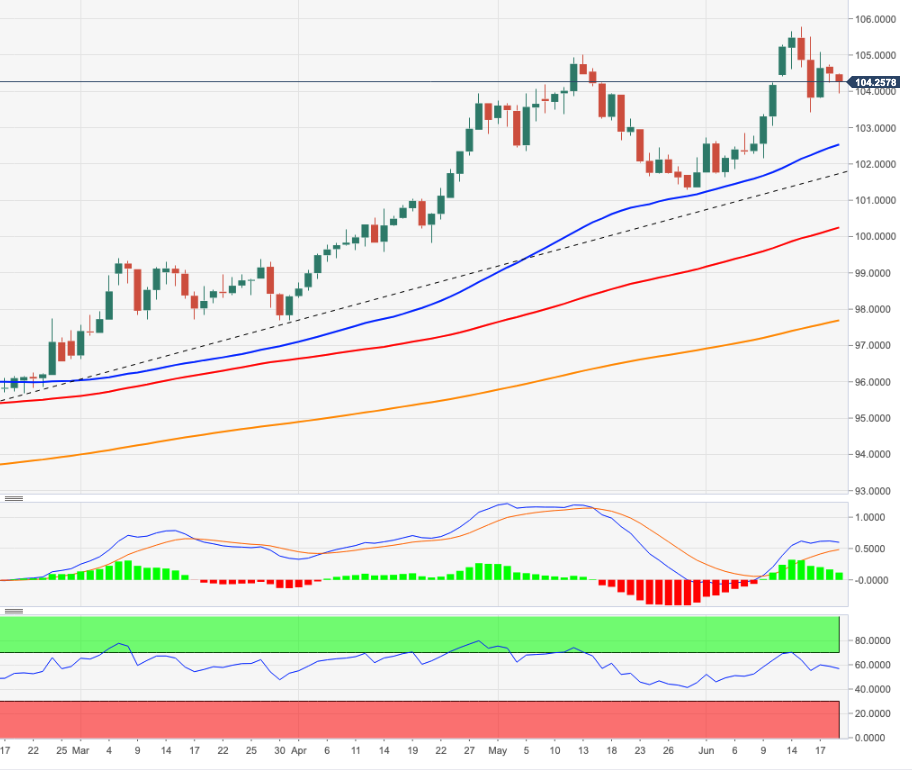
Source: Fx Street
With 6 years of experience, I bring to the table captivating and informative writing in the world news category. My expertise covers a range of industries, including tourism, technology, forex and stocks. From brief social media posts to in-depth articles, I am dedicated to creating compelling content for various platforms.


