
- DXY remains under pressure at the lower end of the range.
- Further weakness could see the post-FOMC high at 105.80 retested.
The US Dollar Index (DXY) extends its downtrend and revisits the area below 106.50, where initial support seems to have appeared so far on Monday.
Considering the ongoing price action, a break below the 106.00 area on the short-term horizon should not be ruled out. On the contrary, the index has the potential to fall further and retest the post-FOMC high at 105.78 (June 15), just before the next Fed meeting.
Despite the current downtrend, the short-term outlook for DXY is seen as constructive as long as it is above the 5-month support line near 103.60.
Also, the broader bullish view holds as long as it is above the 200 SMA at 99.18.
DXY day chart
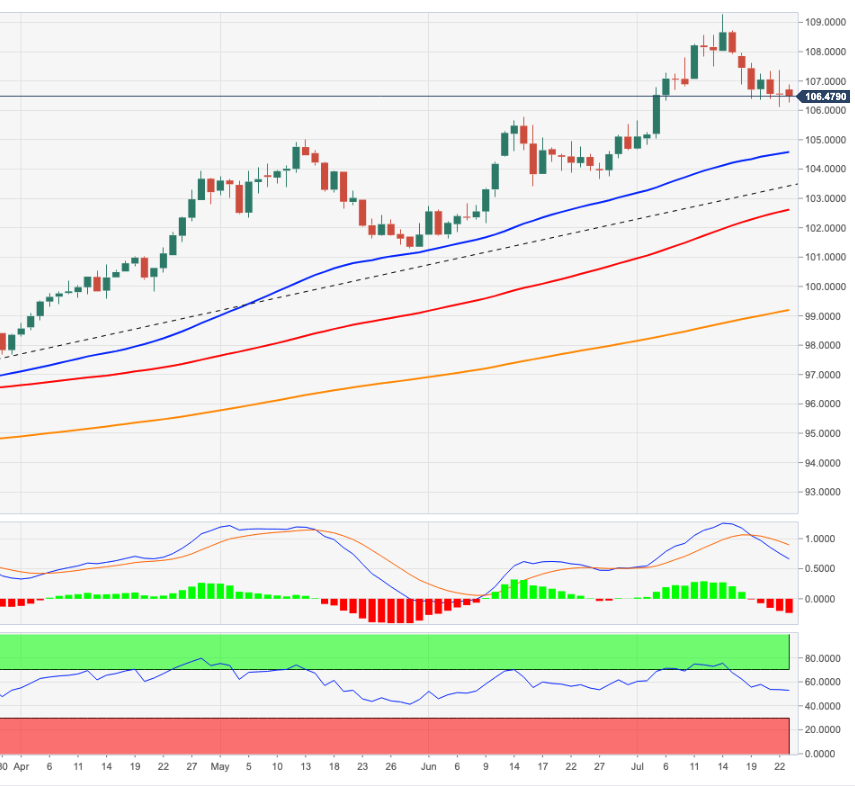
Source: Fx Street
With 6 years of experience, I bring to the table captivating and informative writing in the world news category. My expertise covers a range of industries, including tourism, technology, forex and stocks. From brief social media posts to in-depth articles, I am dedicated to creating compelling content for various platforms.


