
- DXY trims part of Tuesday’s sharp advance above 110.00.
- A new boost could send the dollar back to yearly highs.
The US Dollar Index (DXY) gives back part of its gains after Wednesday’s strong rally driven by US retail inflation data to the 110.00 area.
Despite the fact that the dollar is in a reaction phase, his short-term bullish view remains above the seven-month support line around 106.30.
If sellers push further, then a possible visit to the weekly low at 107.58 (26 Aug), just ahead of the intermediate 55-day Simple Moving Average (SMA) at 107.43, could start to appear on the horizon.
Longer term, DXY is expected to maintain its constructive stance as long as it is above the 200-day SMA at 101.53.
DXY day chart
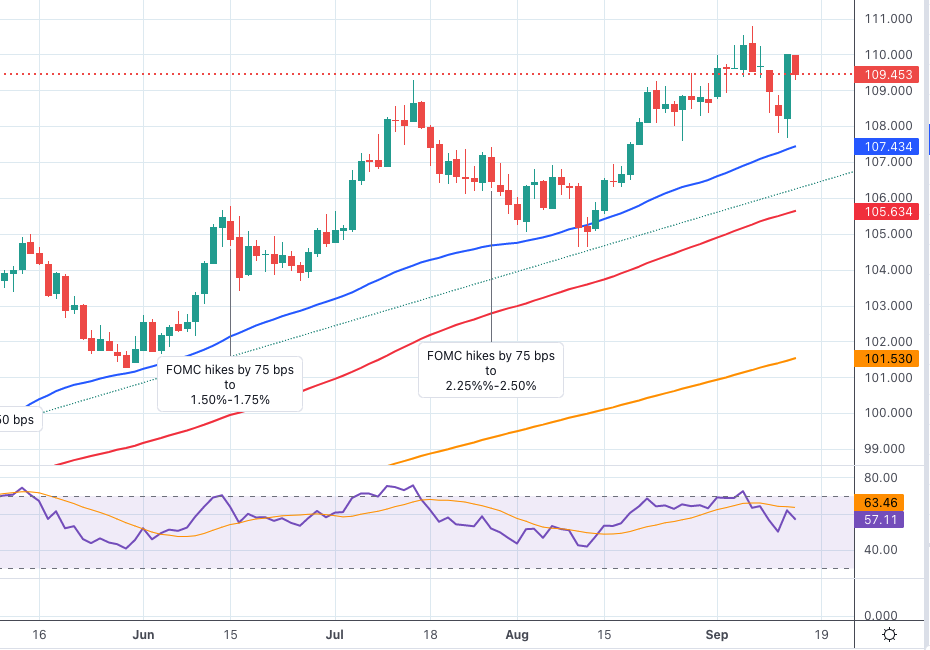
Source: Fx Street
With 6 years of experience, I bring to the table captivating and informative writing in the world news category. My expertise covers a range of industries, including tourism, technology, forex and stocks. From brief social media posts to in-depth articles, I am dedicated to creating compelling content for various platforms.


