
- DXY extends Tuesday’s gains and recovers the area above 109.00.
- Immediately on the upside is the cycle high at 109.47 (Aug 29).
The US Dollar Index trades firmer and extends the rebound past the 109.00 barrier on Wednesday.
The index appears to have entered a consolidation phase, with the lower bound at recent lows near 107.60 (Aug 26 low). On the other hand, further rallies are initially targeting the 2022 high at 109.47 (Aug 29) before the Sept 2002 high at 109.77 and the round level at 110.00.
Meanwhile, if it remains above the 6-month support line around 105.50, DXY is expected to maintain the positive stance in the short term.
As for the long-term scenario, the bullish view of the dollar remains as long as it is above the 200-day simple moving average at 100.87.
DXY day chart
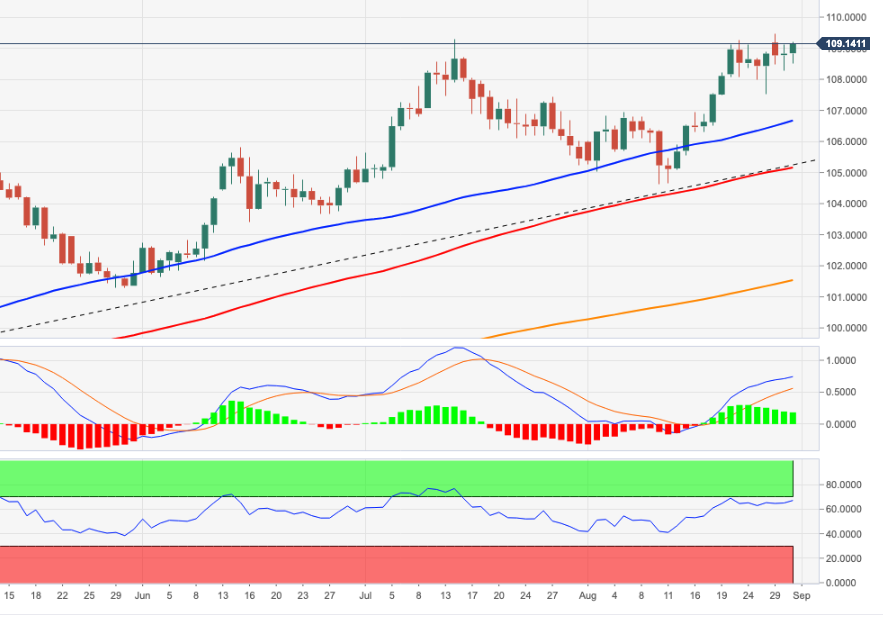
Source: Fx Street
With 6 years of experience, I bring to the table captivating and informative writing in the world news category. My expertise covers a range of industries, including tourism, technology, forex and stocks. From brief social media posts to in-depth articles, I am dedicated to creating compelling content for various platforms.


