
- DXY manages to recover somewhat for now after testing 110.00.
- The loss of 110.00 will expose a possible decline to 109.35.
The US Dollar Index (DXY) rises after two consecutive daily lows and rebounds from fresh lows near the 110.00 support on Wednesday.
Despite the ongoing bounce, further weakness should not be ruled out yet. That said, the break of the 110.00 support should open the door for a likely visit to the weekly low of 109.35 (Sep 20).
Prospects for additional dollar gains should not change as long as the index trades above the 7-month support line near 107.40.
In the longer term, DXY is expected to maintain its constructive stance as long as it is above the 200 SMA at 102.67.
DXY day chart
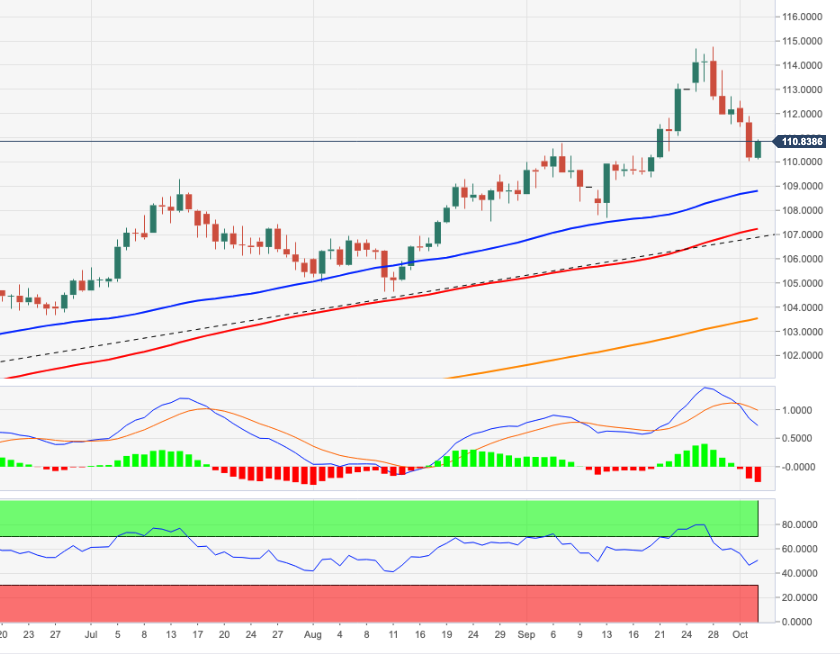
Source: Fx Street
With 6 years of experience, I bring to the table captivating and informative writing in the world news category. My expertise covers a range of industries, including tourism, technology, forex and stocks. From brief social media posts to in-depth articles, I am dedicated to creating compelling content for various platforms.


