
- DXY posted gains for the first time this week.
- The 104.60 zone offers solid containment so far.
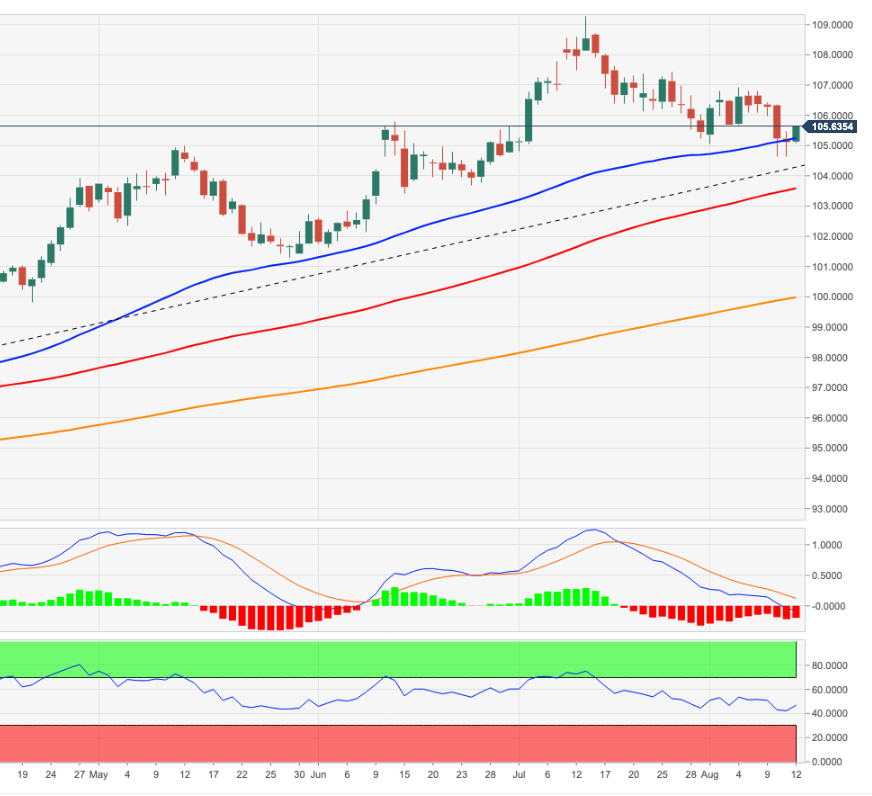
The US Dollar Index (DXY) recovers buying interest and recovers the area above 105.00 at the end of the week.
The index remains well supported by recent lows in the 104.60 region, an area also reinforced by the six-month line. Above this zone, the dollar is expected to maintain the constructive view at least in the short term.
In a broader scenario, the dollar’s bullish view holds as long as it is above the 200-day SMA at 100.04.
DXY day chart
Source: Fx Street
With 6 years of experience, I bring to the table captivating and informative writing in the world news category. My expertise covers a range of industries, including tourism, technology, forex and stocks. From brief social media posts to in-depth articles, I am dedicated to creating compelling content for various platforms.


