
- The DXY index is in buying interest around the 103.20 area midweek.
- A further drop could lead to the 102.30 region.
The us dollar index (DXY) regains his smile after three consecutive daily setbacks.
Despite the current bounce, further downside is still on the table and could now look to next support at 102.35 (May low) where decent support is expected to emerge.
Looking at the bigger picture, the index’s current bullish stance remains supported by the 3-month line around 100.00, while the longer-term outlook for the dollar looks constructive to remain above the 200-day SMA. at 96.44.
DXY day chart
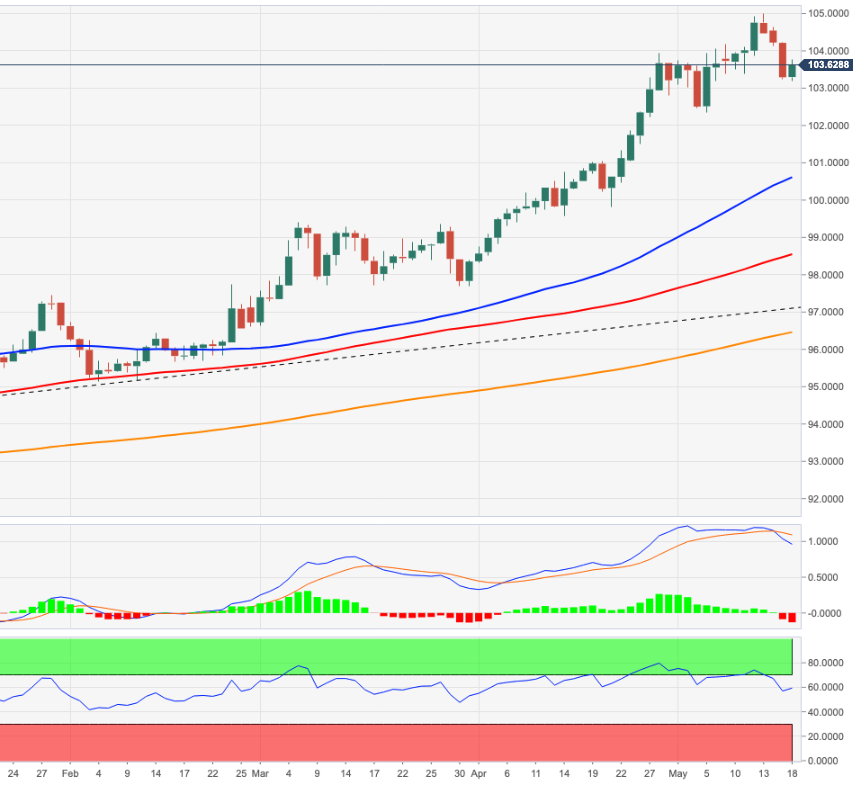
Source: Fx Street
With 6 years of experience, I bring to the table captivating and informative writing in the world news category. My expertise covers a range of industries, including tourism, technology, forex and stocks. From brief social media posts to in-depth articles, I am dedicated to creating compelling content for various platforms.


