
- DXY’s bearish momentum gains strength on Friday.
- Further losses could lead to a visit to the 55-day SMA at 104.73.
The US Dollar Index (DXY) lost ground for the third consecutive session at the end of the week and retested the area below 106.00 for the first time since the beginning of July.
The index broke down from a multi-session consolidation range ahead of the FOMC and in doing so paved the way for more losses in the very short term. That said, immediate support is now found at the 55-day simple moving average at 104.73 before the 5-month support line around 103.85.
The short-term outlook for DXY remains constructive as long as it is above this five-month support line.
Furthermore, the broader bullish view holds as long as it is above the 200-day simple moving average at 99.44.
DXY day chart
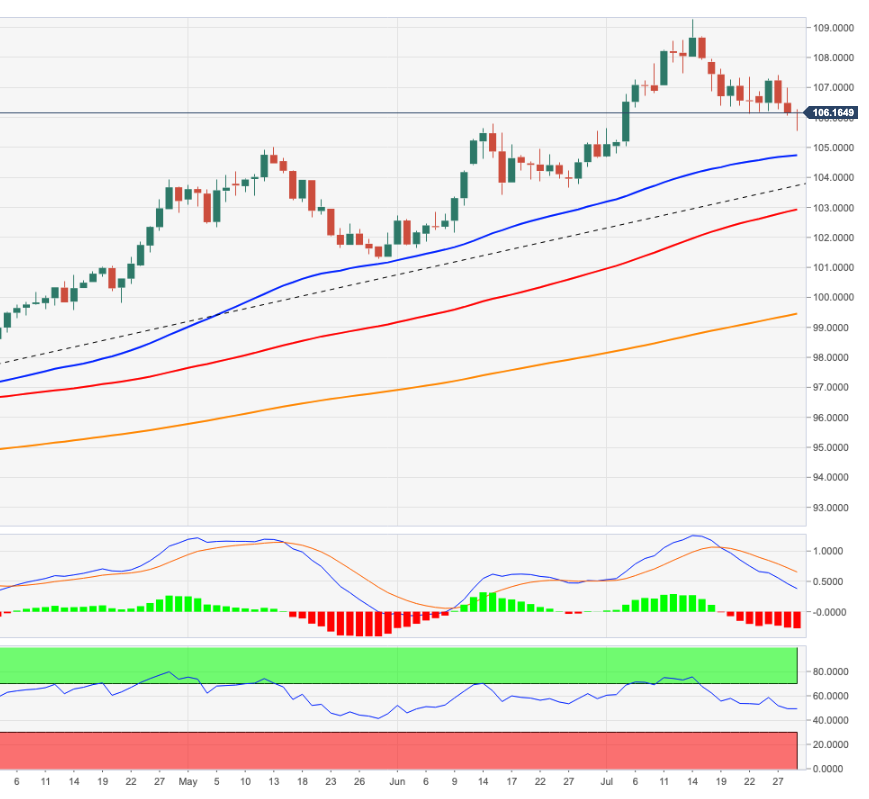
Source: Fx Street
With 6 years of experience, I bring to the table captivating and informative writing in the world news category. My expertise covers a range of industries, including tourism, technology, forex and stocks. From brief social media posts to in-depth articles, I am dedicated to creating compelling content for various platforms.


