
- EUR/CAD is completing a symmetrical triangle pattern on the weekly chart.
- A breakout is expected – probably very soon – leading to a volatile directional move up or down.
- Since the pre-pattern move in 2022-23 was bullish, the odds modestly favor a breakout and continuation to the upside.
EUR/CAD is completing a symmetrical triangle pattern on the weekly price chart, indicating that the pair is ready to break out and move in a volatile directional manner.
EUR/CAD Weekly Chart
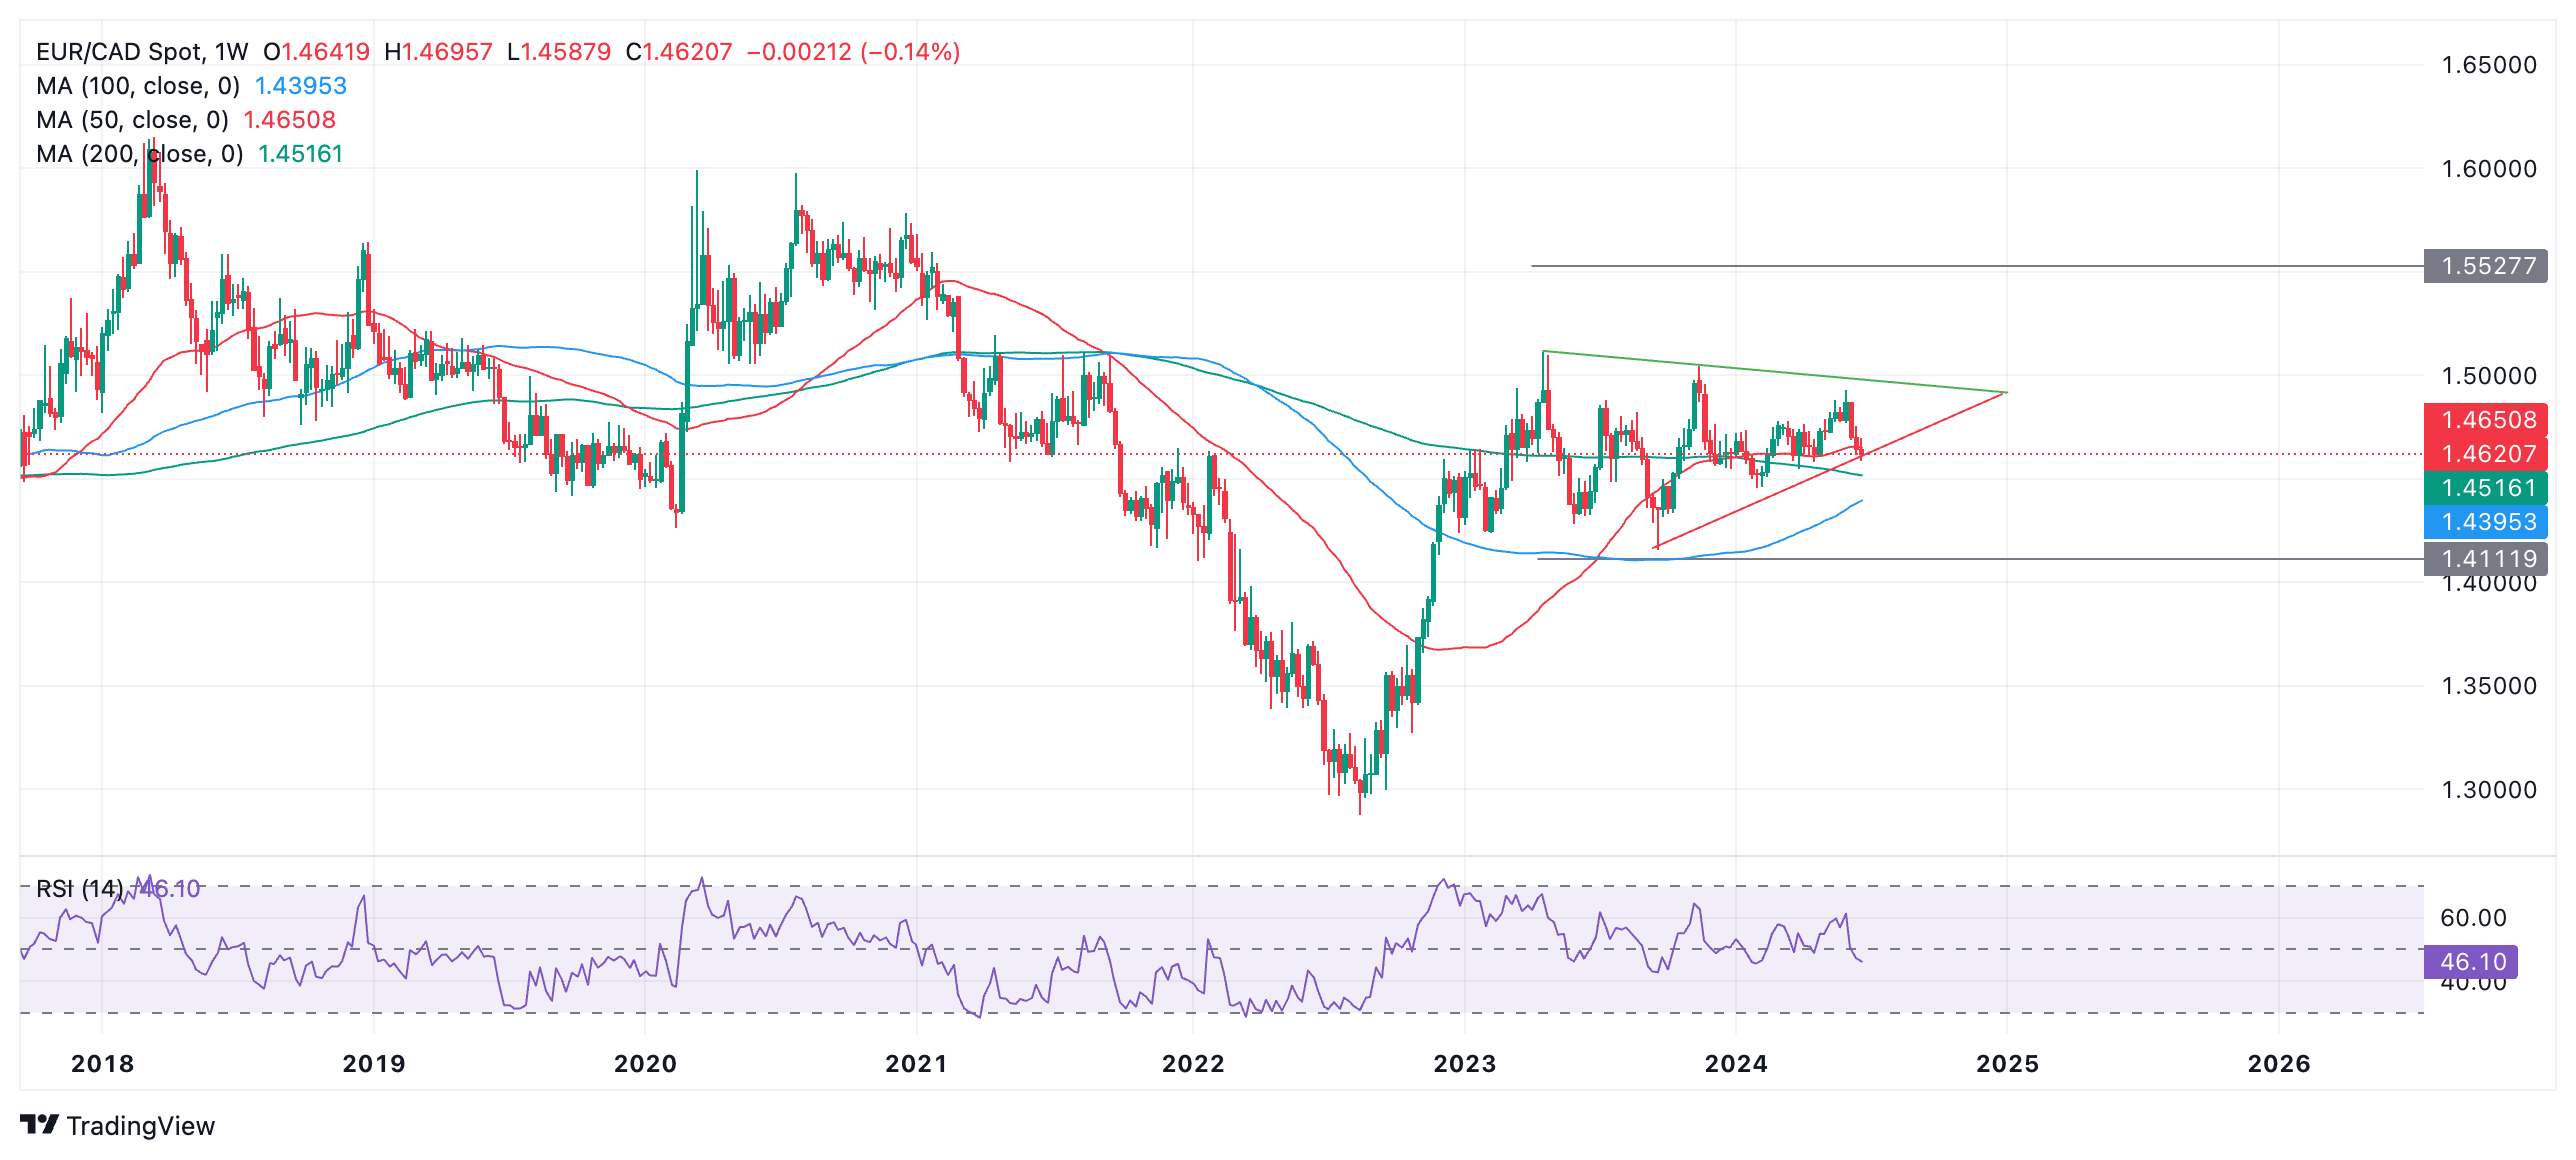
The big picture for EUR/CAD is that the pair bottomed in 2022 and recovered. Since the beginning of 2023, the pair began to consolidate and form a Symmetrical Triangle pattern.
The Symmetrical Triangle (TS) pattern has formed approximately five internal waves, which is the minimum to reach completion. It may be over, therefore, and could break very soon.
An upward breakout is marginally more likely than a downward breakout because the move prior to the formation of the TS was bullish. One could also argue that the pair started a long-term uptrend before the formation of the TS.
A decisive break above the upper boundary line (green) would be indicative of a breakout to the upside. It would be expected to hit a target of around 1.5528, the 0.618 Fibonacci height of the TS at its widest point extrapolated upward from the breakout point.
Likewise, the same applies for a decisive break down, only with a target of around 1.4112.
A decisive breakout to the upside would be defined as a breakout accompanied by a long green weekly candle that closes near its high, or three candles in a row that break out to the upside. In the case of a breakout to the downside, the same would apply only with a red candle in place.
Source: Fx Street
I am Joshua Winder, a senior-level journalist and editor at World Stock Market. I specialize in covering news related to the stock market and economic trends. With more than 8 years of experience in this field, I have become an expert in financial reporting.


 of the afternoon five news")

