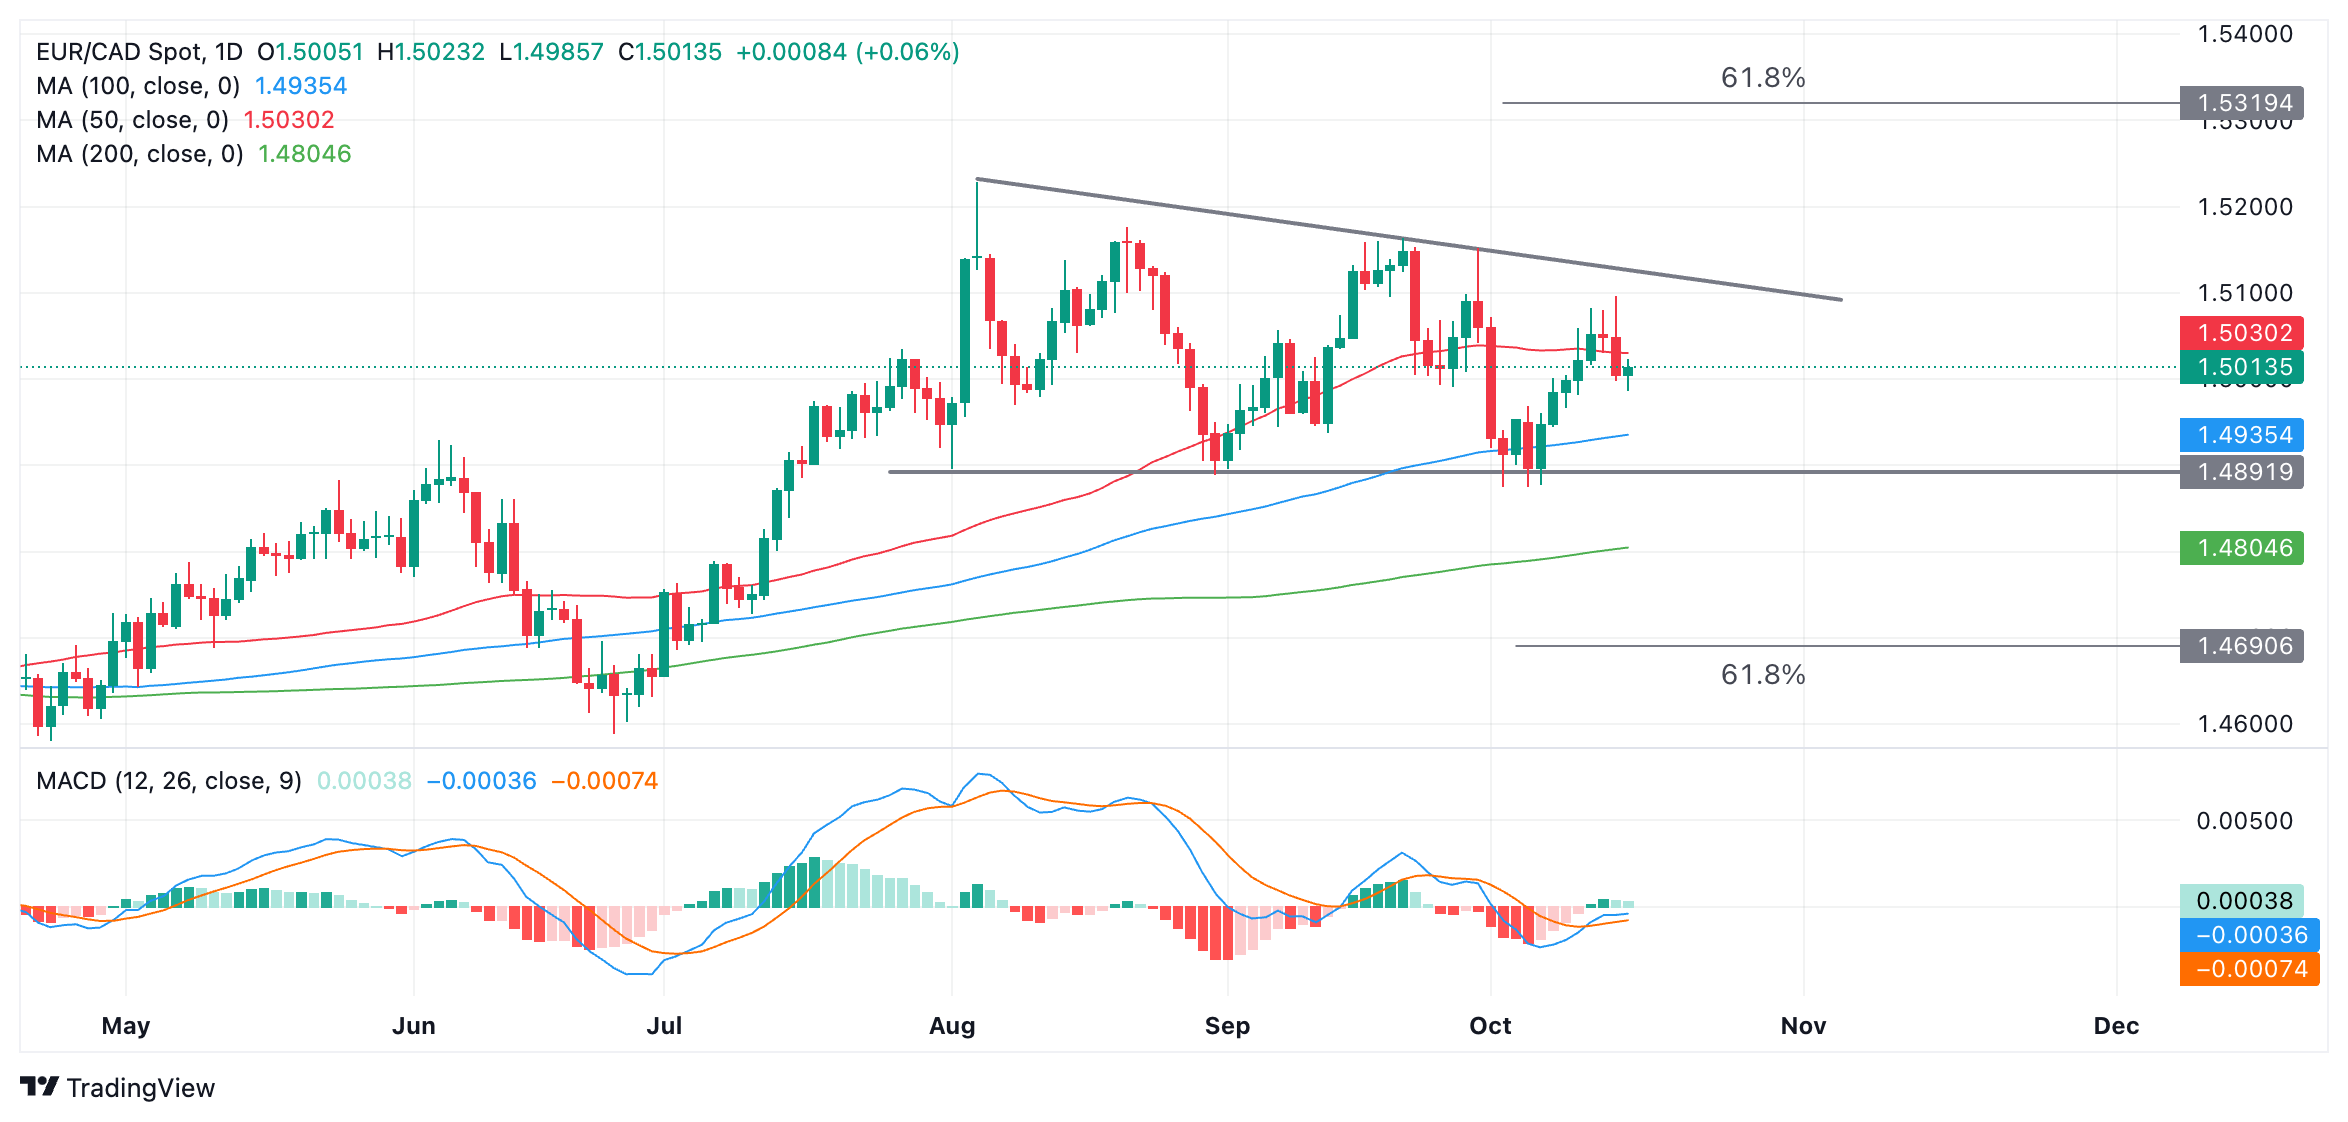
- EUR/CAD oscillates within a ten-week range – the trend is sideways.
- A breakout to the upside or downside would be required to alter the trend to something more directional.
EUR/CAD is bouncing in a ten-week corridor that has a bottom at 1.4890 and a sloping top around 1.5100. That is, the pair is in a sideways trend, limited in a short and medium-term range.
In the long term, the trend is bullish.
EUR/CAD Daily Chart
It will probably continue in its range until it breaks decisively either up or down. The fact that it is in a long-term uptrend would normally marginally favor a breakout to the upside, but the flat bottom of the range negates the bullish bias because it marginally favors a breakout to the downside. In general, there is no obvious bias.
In the event of a breakout to the upside, the pair will likely rise to a target at 1.5319, the 61.8% Fibonacci extrapolation of the height of the upside range. A decisive breakout would be one accompanied by a longer-than-usual green candle that broke clearly above the top of the range and closed near its high, or three green candles that broke above the top of the range.
Alternatively, a decisive break below the range floor is also possible and such a move would likely reach 1.4690, the 61.8% Fibonacci extrapolation to the downside.
Source: Fx Street
I am Joshua Winder, a senior-level journalist and editor at World Stock Market. I specialize in covering news related to the stock market and economic trends. With more than 8 years of experience in this field, I have become an expert in financial reporting.


