
- EUR/GBP falls to 9-month lows as ECB nears top rate and BoE poised to continue tightening.
- The pair signals oversold conditions on the daily chart for the first time since 2021.
- Weak economic data from Italy and Germany contribute to the fall of the Euro.
The pair EUR/GBP has recently experienced a substantial decline, falling to a nine-month low of 0.8540 and stabilizing around 0.8545. This prolonged downward trend reflects the difficulties the Euro is facing in the midst of the economic recession in the Euro Zone. However, there is some optimism about the UK economy as Bank of England forecasts indicate that the UK is likely to move out of recession. In addition, high inflation in the UK is fueling hawkish bets from the Bank of England (BoE), giving sterling additional support.
German yields fall on weak economic data
The Italian National Institute of Statistics published that Italian industrial production decreased by 1.9% in April, compared to the expansion of 0.1% expected from the previous data, which also showed a contraction of -0.6%. In annual terms, production has fallen by 7.2%. In addition, the euro area reported weak final revisions to first quarter gross domestic product (GDP) on Thursday, while Germany (the euro area’s largest economic bloc) is in a technical recession.
German yields weakened across the curve on Friday. The yield on the 10-year bond fell to 2.37%, while the 2-year yield stood at 2.96% and the 5-year yield at 2.42%. In addition, the German DAX index closed the week with a loss of 0.60%, indicating a negative sentiment towards economic activity in Germany and, therefore, a selling pressure on the euro.
For the next decision of the European Central Bank (ECB) next week, the markets anticipate a rate hike announcement of 25 basis points (bp) and another in July or September. As for the Bank of England, market participants expect a rise of 100 basis points, to 5.50%, for the rest of the tightening cycle.
technical levels
According to the daily chart, the EUR/GBP pair has a short-term bearish outlook as the RSI and MACD suggest that sellers are in control, while the pair is trading below its main moving averages.
Should the pair continue lower, support levels line up at the multi-year low at 0.8540 and below around the 0.8535 area and the 0.8520 level. Conversely, should the EUR/GBP regain traction, next resistance lines up at the 0.8560 zone followed by 0.8580 (7 Jun low) and the key psychological level 0.8600.
EUR/GBP daily chart
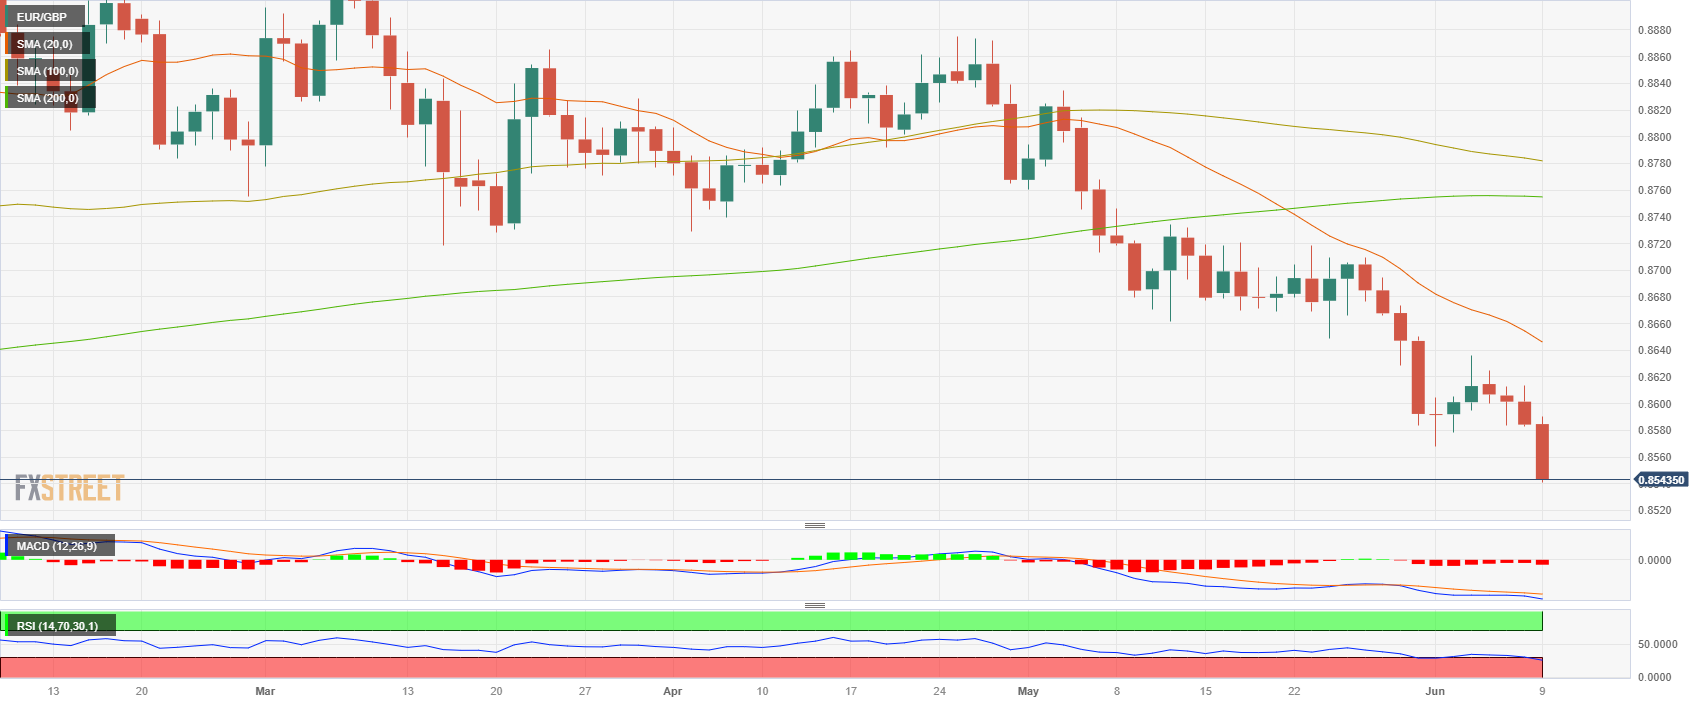
Source: Fx Street
I am Joshua Winder, a senior-level journalist and editor at World Stock Market. I specialize in covering news related to the stock market and economic trends. With more than 8 years of experience in this field, I have become an expert in financial reporting.


