
- EUR/GBP price has fallen to support at the top of a multi-month range at 0.8590.
- Despite the bearish signals, the pair could rally as the short-term trend remains technically bullish.
- However, a decisive break below the support level would indicate a deeper retracement within the range.
The EUR/GBP pair has pulled back and fallen to a key support level around 0.8590, where it is currently consolidating.
During volatile trading on April 19, the pair broke out of its multi-month range and rose to a high of 0.8645, however, it quickly reversed and fell again.
EUR/GBP Daily Chart
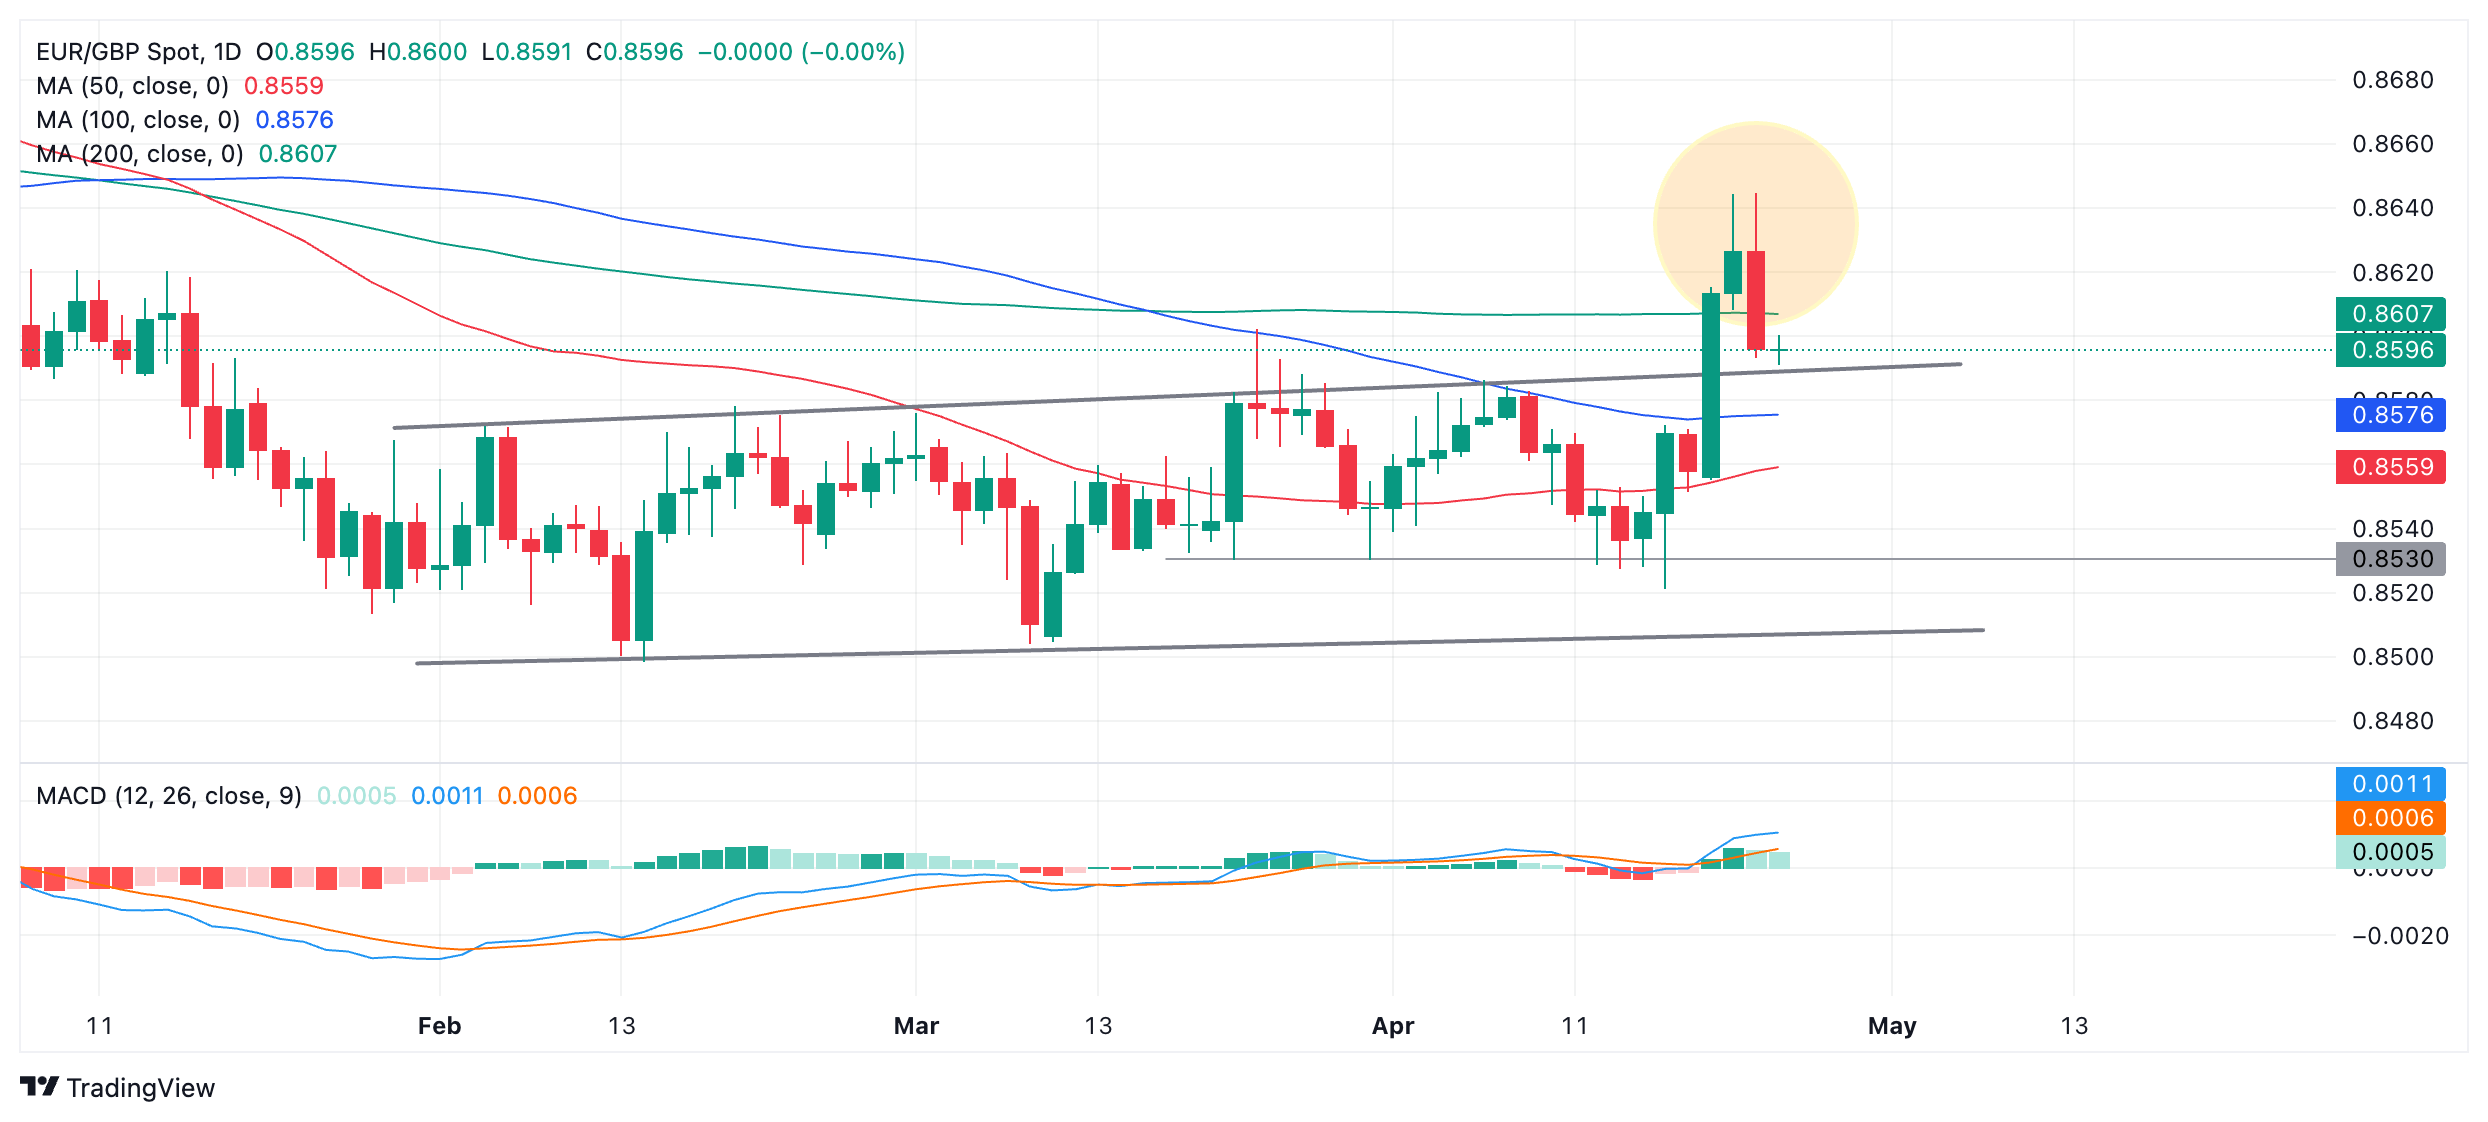
EUR/GBP reached its initial conservative target for the range breakout at the 0.618% Fibonacci extrapolation of the upper range height. This could mean no more hikes. However, if the pair hits the bullish target for the breakout, it could still rally to around 0.8660.
The pair formed a bearish Tweezer Top candlestick pattern at highs (marked with a circle) which occurs when two consecutive days have similar candle wicks (the thin top of the candle) and these wicks end at similar highs. It is a fairly reliable reversal signal.
The support level currently supporting the price is the top of a range that began in February. It is likely to be a tough nut for the bears to crack and push the price lower.
A decisive break below the top of the range would be necessary to confirm further possible weakness towards a target at 0.8530.
A decisive breakout means a breakout by a long candlestick that closes near its low or a breakout by three consecutive red candlesticks.
4 hour chart
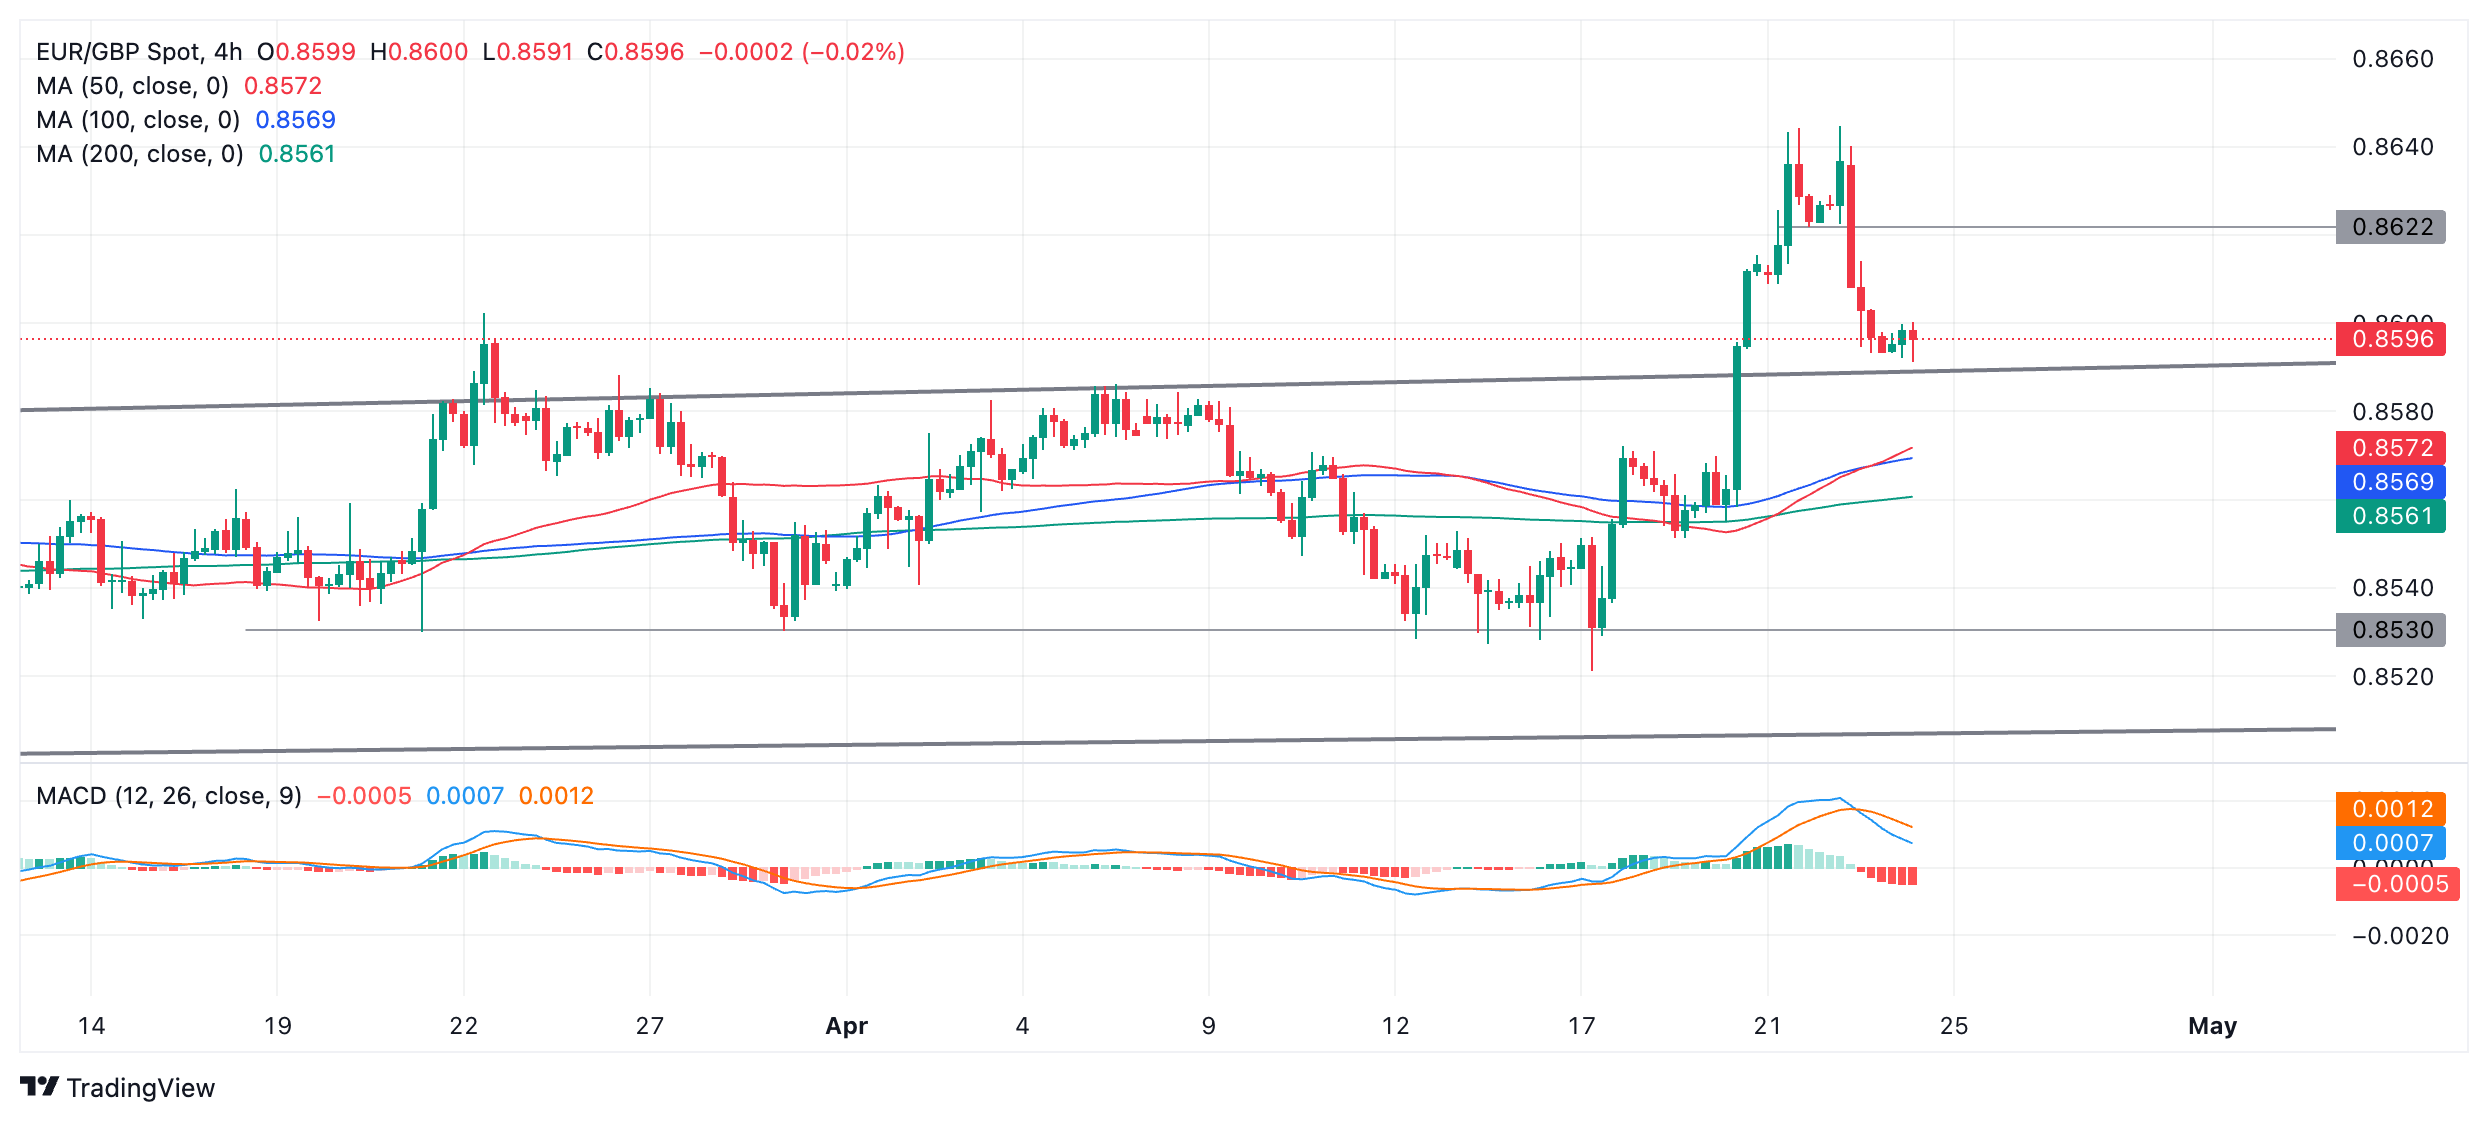
The 4-hour chart shows the formation of a bearish M-shaped double top at the April 22-23 highs. Subsequently, the pattern broke below its neck line (gray line at 0.8622) and plummeted. It has reached its price target, which is equivalent to the height of the pattern extrapolated downwards. This suggests a decline in bearish momentum.
Technically, the pair is not in a short-term downtrend despite the recent weakness. Ideally, it should form a more consistent trend of declining highs and lows before you can say it is in a downtrend.
Given that there remains a chance that EUR/GBP is in an uptrend, and that range-top support has yet to be broken, further rallies materializing remains a very real possibility.
The double top neckline level at 0.8622 is likely to present resistance if a bullish move occurs.
Source: Fx Street
I am Joshua Winder, a senior-level journalist and editor at World Stock Market. I specialize in covering news related to the stock market and economic trends. With more than 8 years of experience in this field, I have become an expert in financial reporting.


