
- Technical indicators are sending signs of weakening bulls, with the RSI in oversold territory and the MACD showing decreasing green bars.
- The 20-day SMA support has disappeared.
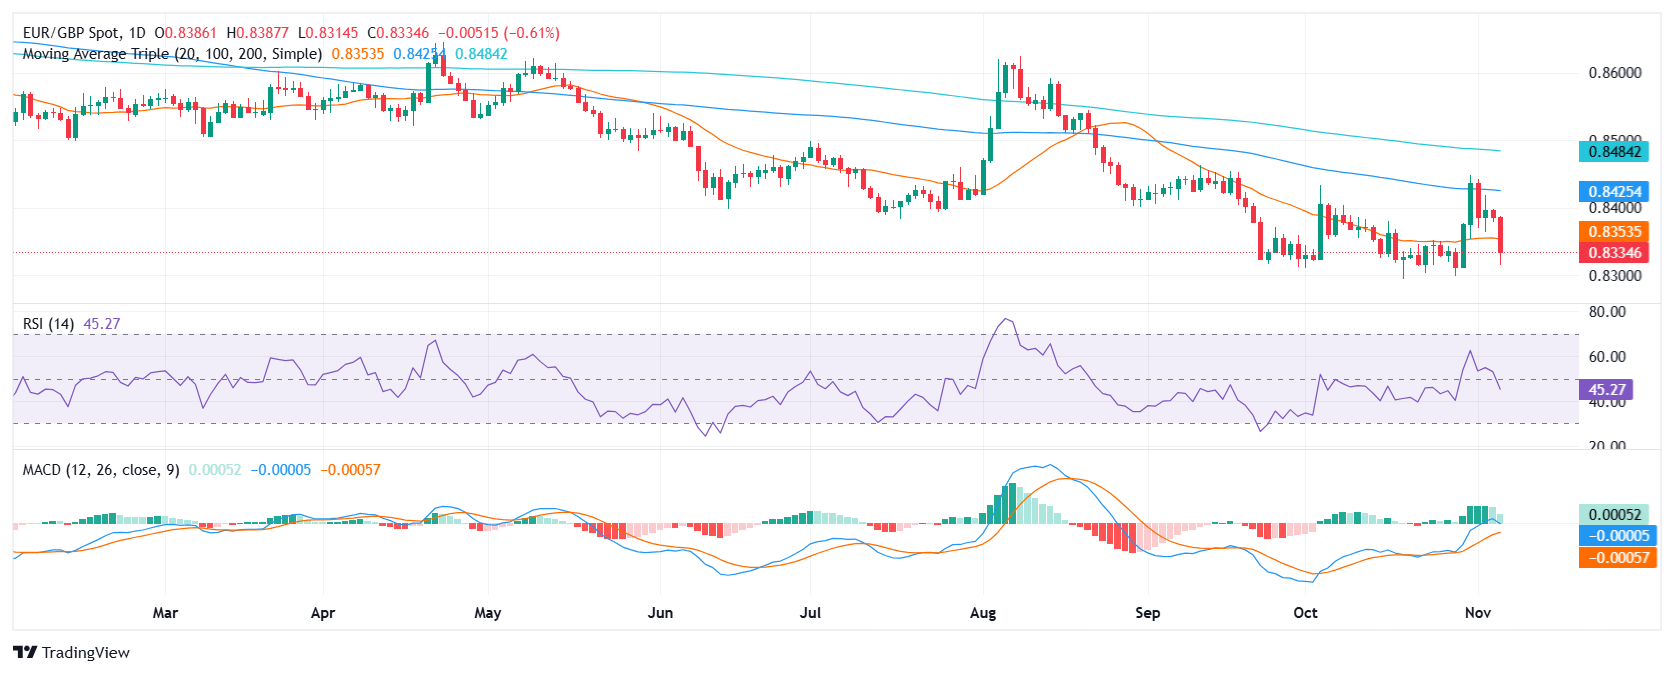
Wednesday’s EUR/GBP market has been dominated by significant losses, extending a bearish trend that has lasted for the last seven trading sessions. This downward momentum has pushed the pair below its 20-day SMA and to its lowest point in over a week.
Technical indicators present a nuanced perspective. The Relative Strength Index (RSI), which measures the strength or weakness of price movements, has fallen into negative territory and its downward trajectory indicates an increase in selling pressure. The current RSI value of 45 places it in the negative zone. The Moving Average Convergence/Divergence (MACD) indicator, a trend-following indicator, displays decreasing green histogram bars. This suggests that buying pressure is easing.
The EUR/GBP cross plunged and lost the 20-day simple moving average (SMA), indicating a possible downtrend. This drop pushed the cross to its lowest point in over a week, further suggesting bearish sentiment. Supports now line up at 0.8330, 0.8315 and 0.8300.
EUR/GBP Daily Chart
Source: Fx Street
I am Joshua Winder, a senior-level journalist and editor at World Stock Market. I specialize in covering news related to the stock market and economic trends. With more than 8 years of experience in this field, I have become an expert in financial reporting.


