
- The euro accelerates its downward trend and approaches 0.8600.
- The bears have taken over after the ECB confirmed market expectations.
- The pair should go back above 0.8690 to relieve negative pressure.
The EUR accelerates its downtrend in the American session on Thursday, as the cross reversal from session highs at 0.8690, extends to the 0.8600 area to test support at the 100-day SMA.
The bears took over the common currency after the European Central Bank confirmed market expectations and raised interest rates by 0.75% for the second time in a row, leaving its deposit rate at 1.5%, its highest level since 2009. .
The pair fell immediately after the release of the ECB’s monetary policy decision, against a pound sterling that continues to benefit from investor relief following the appointment of Rishi Sunak as British Prime Minister.
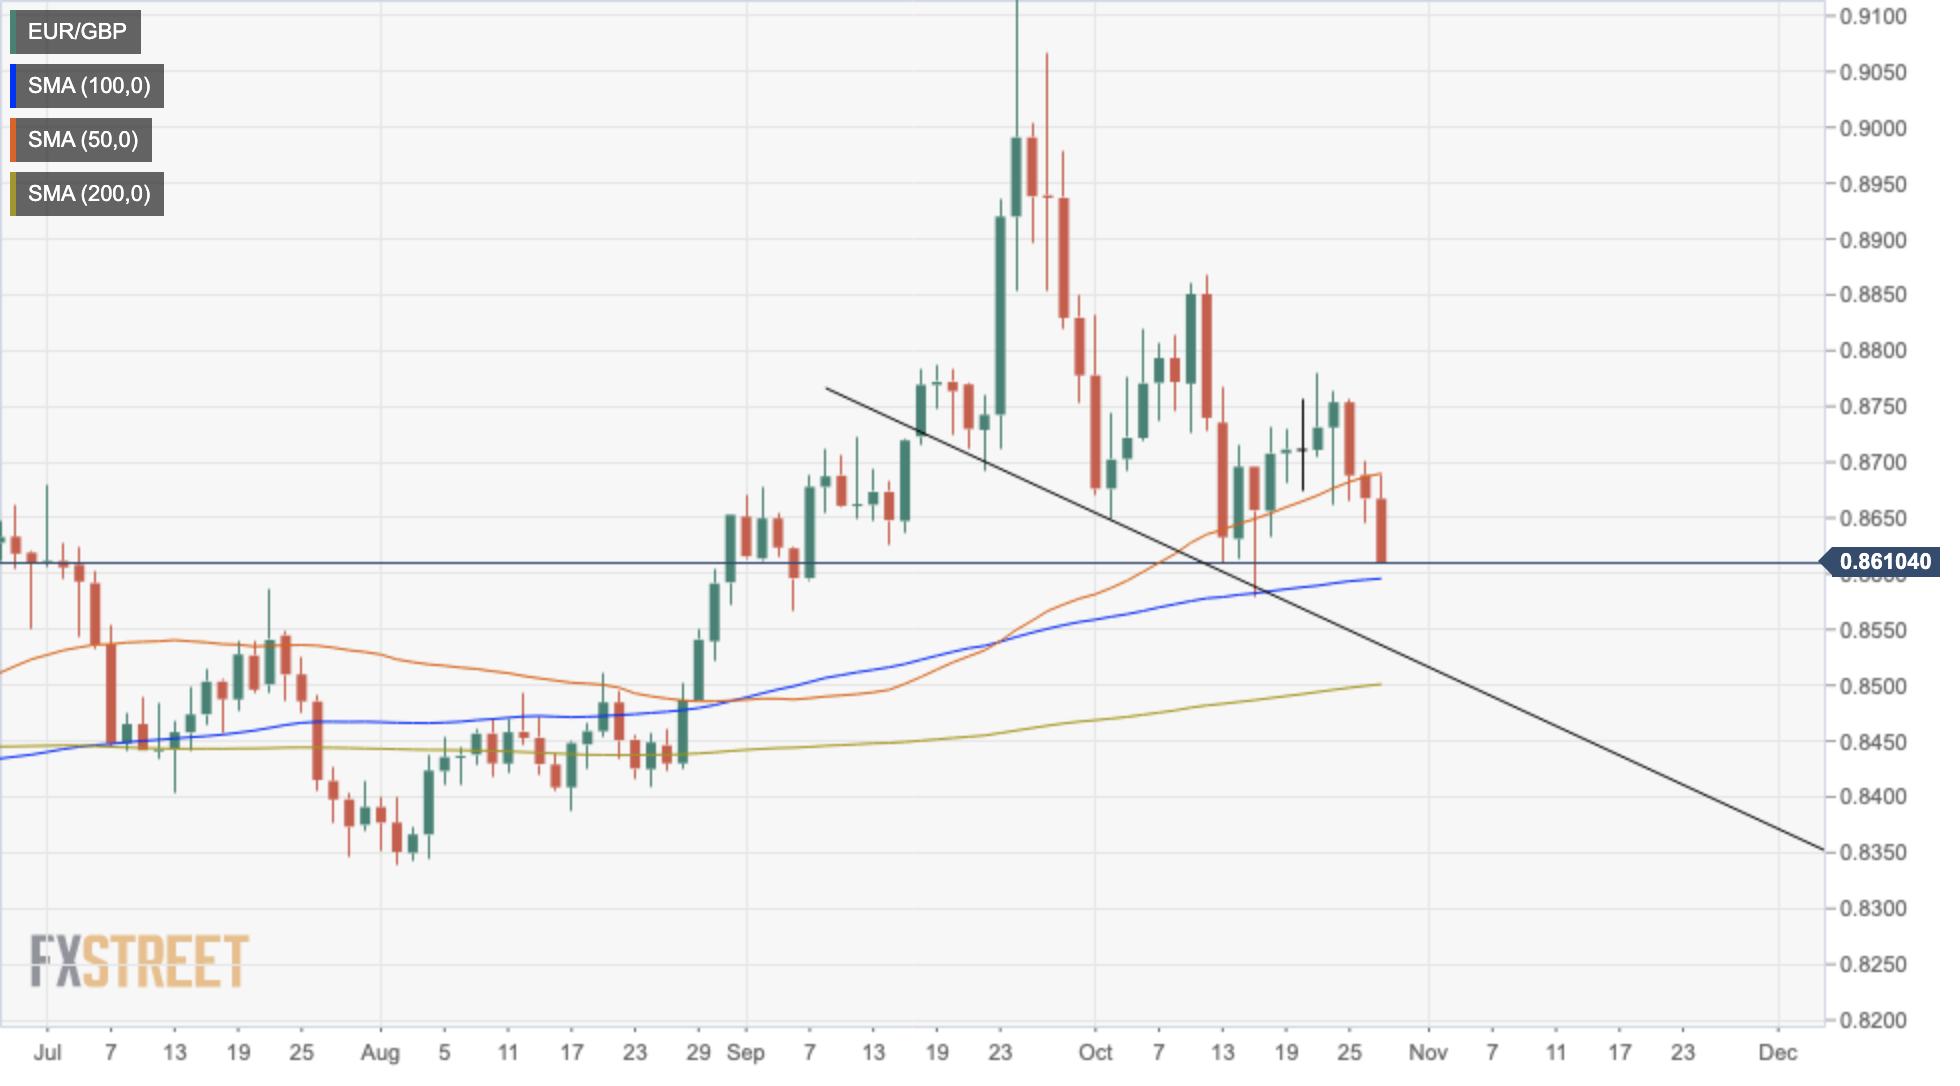
From a technical point of view, the failure of the euro to break above the 50-day SMA again has added to the downside pressure, pushing the pair towards the 100-day SMA at 0.8600. Below here, the next downside targets would be the downtrend line support from the mid-November lows now at 0.8535 and the 200-day SMA at 0.8500.
Bullish, a bullish reaction would have to break above the aforementioned 50-day SMA at 0.8690 to head for the Oct 21 high at 0.8780. A confirmation above the mentioned level would negate the downtrend and open the way to the 12 Oct high at 0.8870.
EUR/GBP daily chart
Technical levels to watch
Source: Fx Street
With 6 years of experience, I bring to the table captivating and informative writing in the world news category. My expertise covers a range of industries, including tourism, technology, forex and stocks. From brief social media posts to in-depth articles, I am dedicated to creating compelling content for various platforms.


