
- EUR/GBP keeps the bullish bias intact, despite having broken through 0.8700 earlier in the session on Thursday.
- EUR/GBP Price Analysis: Break Above 0.8760 Would Pave Way For Higher Trading; otherwise, a drop to 0.8625 is anticipated.
The EUR/GBP rises after testing a two-week rising trendline, drawn from the 2nd and 14th of September lows, which breaks through the 0.8700 level. During the day, EUR/GBP fell to a daily low, below the aforementioned trend line at 0.8691, but bounced back and reached a daily high at 0.8760 before stabilizing at current levels. At the time of writing, the EUR/GBP is trading at 0.8737, above its opening price.
EUR/GBP Price Analysis: Technical Outlook
From a daily chart perspective, the EUR/GBP drop towards 0.8700 was expected. Oscillators, particularly the Relative Strength Index (RSI), peaked just short of entering overbought conditions three times since August 31, opening the door for a pullback. Once the decision of the Bank of England (BoE) was known, the euro gained traction and the buyers recovered the thresholds of 0.8700, keeping the bullish bias intact.
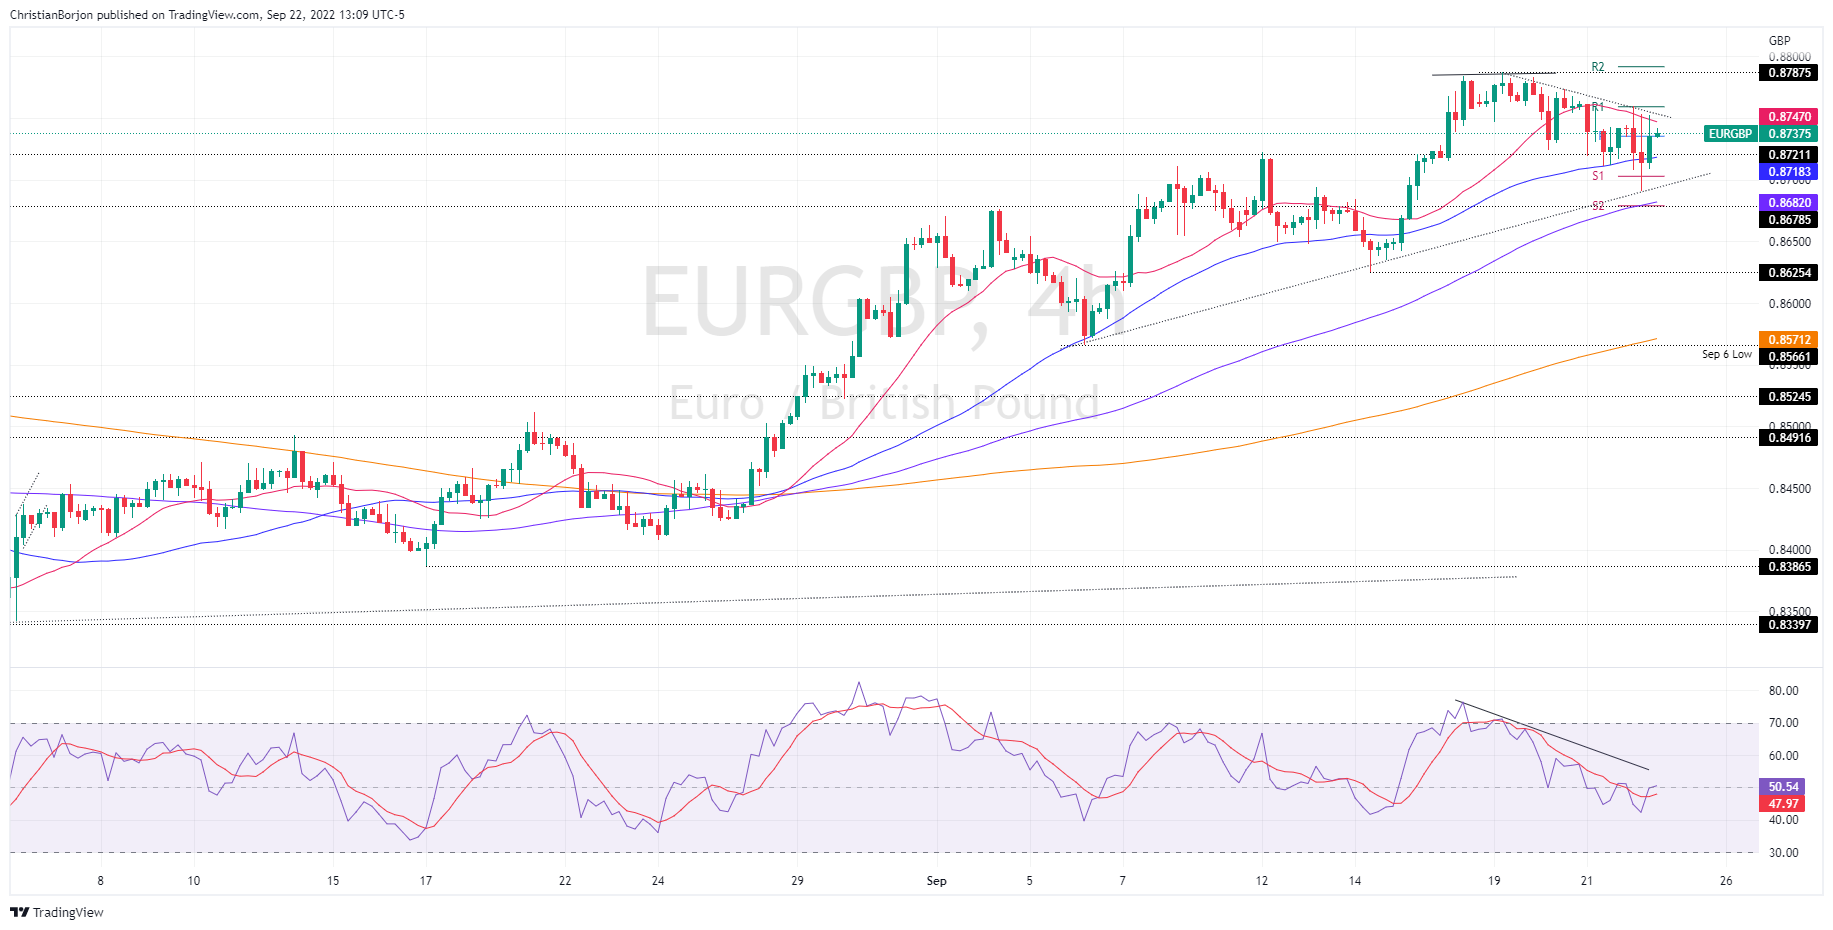
Switching to an intraday time frame, the EUR/GBP four-hour chart illustrates that the pair has a neutral to bearish bias, with some solid resistance levels above the current exchange rate that could limit the EUR/GBP recovery. Breaking above the EUR/GBP daily high at 0.8760 could pave the way for the yearly high at 0.8787, ahead of the psychological level at 0.8800.
Conversely, a drop below the S1 daily pivot at 0.8702 would expose the weekly low at 0.8691, followed by the confluence of the S2 pivot and the 100 EMA around 0.8680/82, and then the 14th Sep low at 0.8625.
EUR/GBP Key Technical Levels
Source: Fx Street
With 6 years of experience, I bring to the table captivating and informative writing in the world news category. My expertise covers a range of industries, including tourism, technology, forex and stocks. From brief social media posts to in-depth articles, I am dedicated to creating compelling content for various platforms.


