
- EUR/GBP breaks above the 50 and 20 day EMAs, reflecting further bearish sentiment and is trading 0.14% below the open.
- EUR/GBP is breaking both the daily EMA and the support trend line from a month ago, so further losses are in store for the cross as sellers gain momentum.
- A close below 0.8600 could accelerate the decline towards the July 27 low, with eyes set on the lowest point of the year. Immediate resistance is at the 0.8600-0.8610 zone.
EUR/GBP fell for the third day in a row, extending its losses beyond the 50 and 20-day EMAs, last seen each at 0:8610 and 0.8603. At the time of writing, the EUR/GBP is trading at 0.8582, below its opening price by 0.14%.
EUR/GBP Price Analysis: Technical Perspective
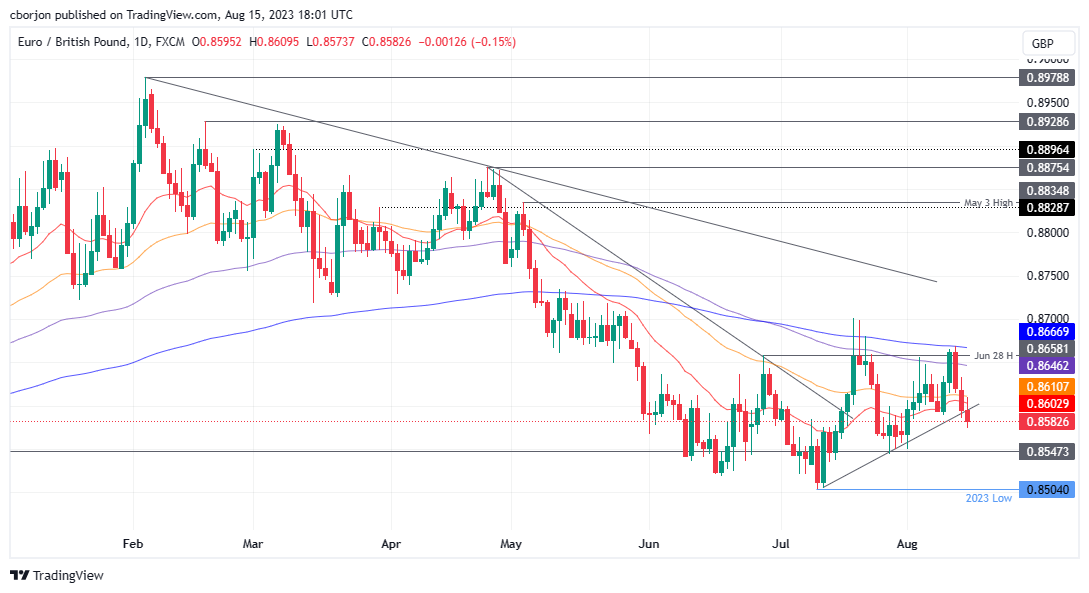
EUR/GBP is trading sideways, slightly lower, after prices fell below all of the daily EMAs, opening the door for further losses. In particular, EUR/GBP fell to a fresh two-week low and, in its decline, has broken a month-old support trend line drawn from yearly lows, suggesting that sellers are gathering momentum.
If the EUR/GBP pair achieves a daily close below 0.8600, the cross could extend its downtrend to a July 27 low at 0.8544, before challenging the year-to-date (YTD) low at 0.8504.
On the other hand, if EUR/GBP buyers recapture 0.8600, the first resistance levels would be the 0.8601/10 zone, followed by the 100 day EMA at 0.8646.
EUR/GBP Price Action – Daily Chart
Source: Fx Street
I am Joshua Winder, a senior-level journalist and editor at World Stock Market. I specialize in covering news related to the stock market and economic trends. With more than 8 years of experience in this field, I have become an expert in financial reporting.


