
- Overall, EUR/GBP is consolidating sideways without a clear trend.
- The RSI suggests increasing selling pressure, while the MACD indicates decreasing buying pressure in the short term.
- The bulls failed to defend the 20-day SMA, making the outlook worse.
The EUR/GBP pair is trading around 0.8380, consolidating sideways and showing no clear trend. Furthermore, the cross lost the 20-day SMA, which could indicate a bearish leg.
Technical indicators show that the bulls are pulling back. The Relative Strength Index (RSI) is at 46 in negative and declining territory, indicating increasing selling pressure. The Moving Average Convergence/Divergence (MACD) indicator displays a decreasing green histogram, suggesting a decrease in buying pressure.
Bullish pressure may prevail if the price manages to break the 0.8400 resistance level and stay firmly above the 20-day SMA. If that happens, the EUR/GBP pair could rise to 0.8450 or even 0.8500. On the other hand, a drop below the 0.8320 support level could lead to further declines below 0.8300.
EUR/GBP Daily Chart
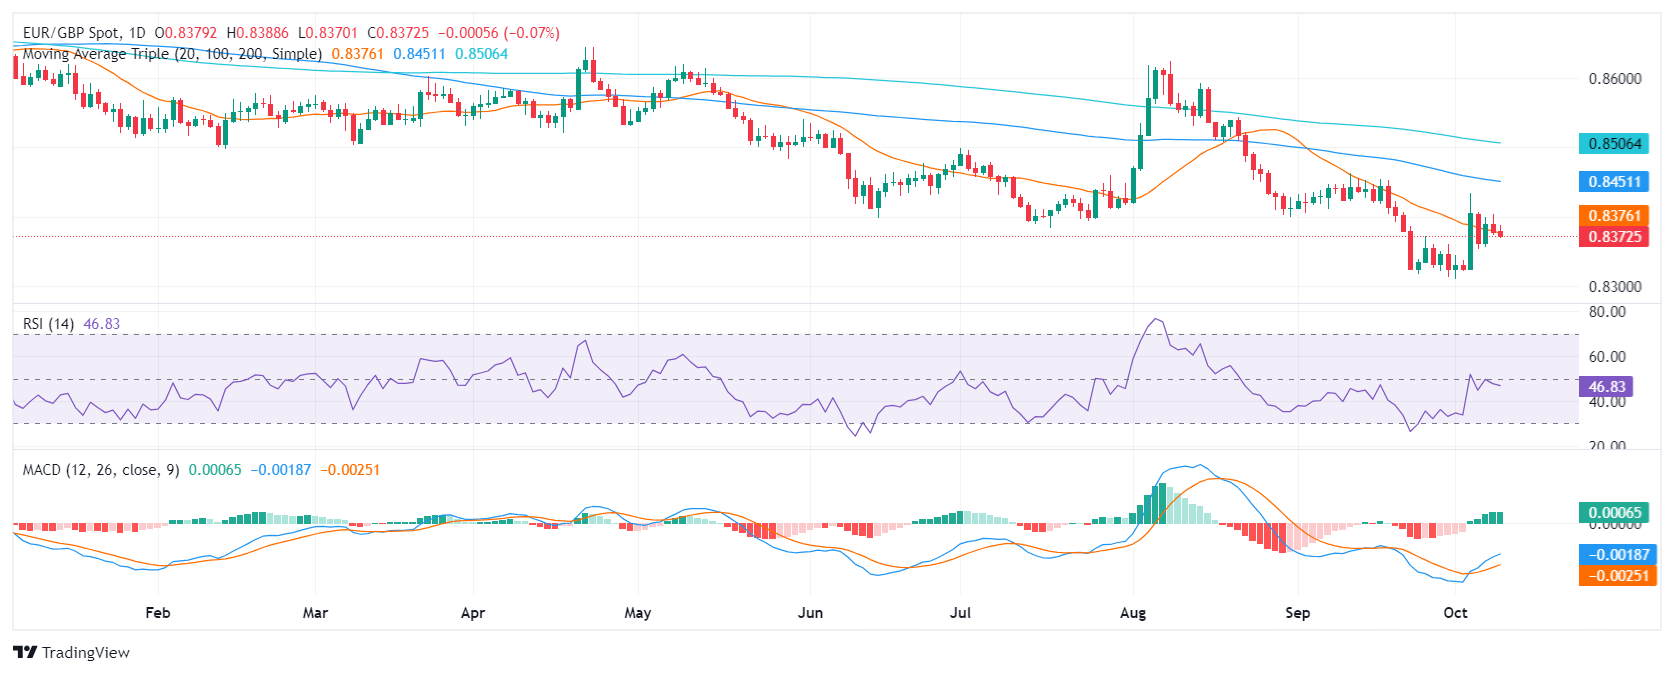
Source: Fx Street
I am Joshua Winder, a senior-level journalist and editor at World Stock Market. I specialize in covering news related to the stock market and economic trends. With more than 8 years of experience in this field, I have become an expert in financial reporting.


