
- EUR/GBP falls to a fresh seven-day low at 0.8546, influenced by market expectations of a Bank of England rate hike and continued ECB stance.
- Technical Analysis shows that the pair struggles to break out of the 50-day SMA at 0.8582, maintaining a downtrend with a year-to-date low of 08492 in the offing.
- Despite the downtrend, a falling wedge pattern suggests upside potential, with key resistance levels at 0.8572 and 0.8600 to watch.
The Euro (EUR) loses ground against the British Pound (GBP) amid risk-on momentum as well as expectations that the European Central Bank (ECB) will keep interest rates unchanged. At the same time, market analysts see the Bank of England (BoE) as the only one that could raise rates by 25 basis points in September. This, coupled with technical resistance, dragged EUR/GBP to a fresh 7-day low, as the pair trades at 0.8546 after hitting a high of 0.8559.
EUR/GBP Price Analysis: Technical Perspective
On the daily chart, the pair tested the 50-day SMA at 0.8582, but buyers failed to break through to the upside, so the pair extended its losses towards current exchange rates. As the pair records a successive series of lower highs and lower lows, the downtrend is intact, and if the pair breaks the year-to-date low at 0.8492, it would be tested at 0.8408 on August 24, 2022.
On an intraday basis, the EUR/GBP pair is trending down, but is forming a falling wedge, a bullish chart pattern, which could pave the way for further gains. If the pair breaks higher, the first resistance would be the 200 hour SMA (HSMA) at 0.8572, followed by the psychological level at 0.8600 and last week’s high at 0.8610.
If the pair manages to stay within the chart pattern, it is seen further to the downside at the bottom of the falling wedge around 0.8530/20, which, if broken, EUR/GBP could fall towards the year low of 0.8492 .
EUR/GBP Price Action – Hourly Chart
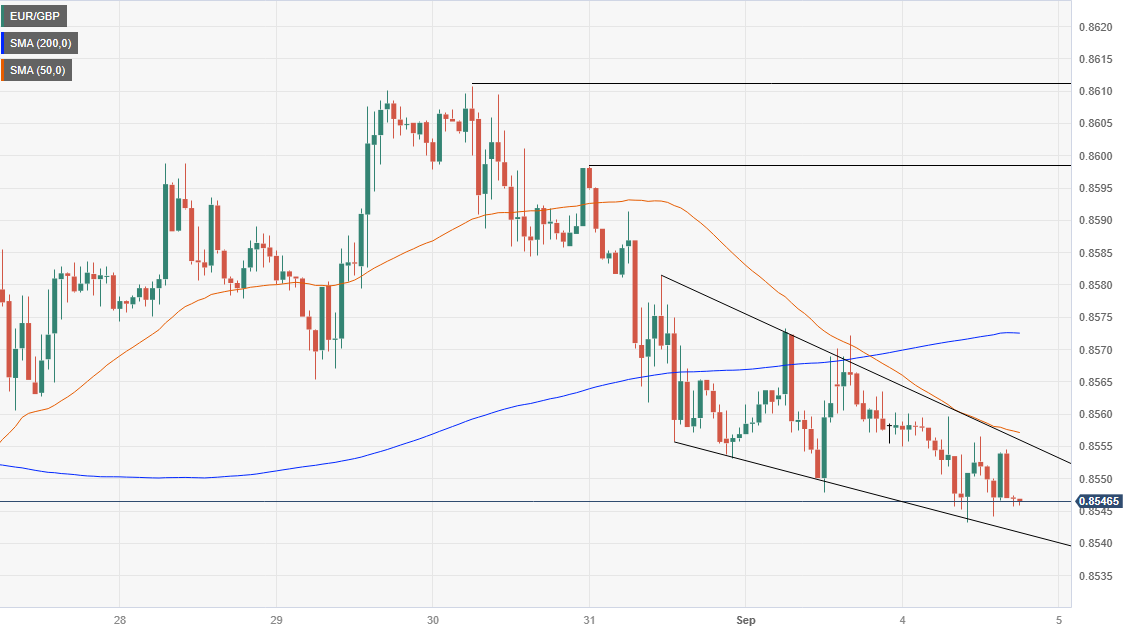
Source: Fx Street
I am Joshua Winder, a senior-level journalist and editor at World Stock Market. I specialize in covering news related to the stock market and economic trends. With more than 8 years of experience in this field, I have become an expert in financial reporting.


