
- EUR/GBP weakens further as buying pressure continues to recede.
- The latest price action and technical indicators suggest that further downside is on the horizon.
- The 0.8380 presents a strong barrier against sellers.
Thursday’s session saw EUR/GBP decline slightly by 0.20% below 0.8400. Looking at the technical aspects, the overall bias remains bearish as selling pressure intensifies, the cross must hold the 0.8380 line to avoid further losses.
The RSI is currently at 37 and is sharply declining in the negative area, indicating that selling pressure is increasing. Moreover, the MACD indicator also suggests that selling pressure is increasing as the histogram is red and on the rise.
EUR/GBP daily chart
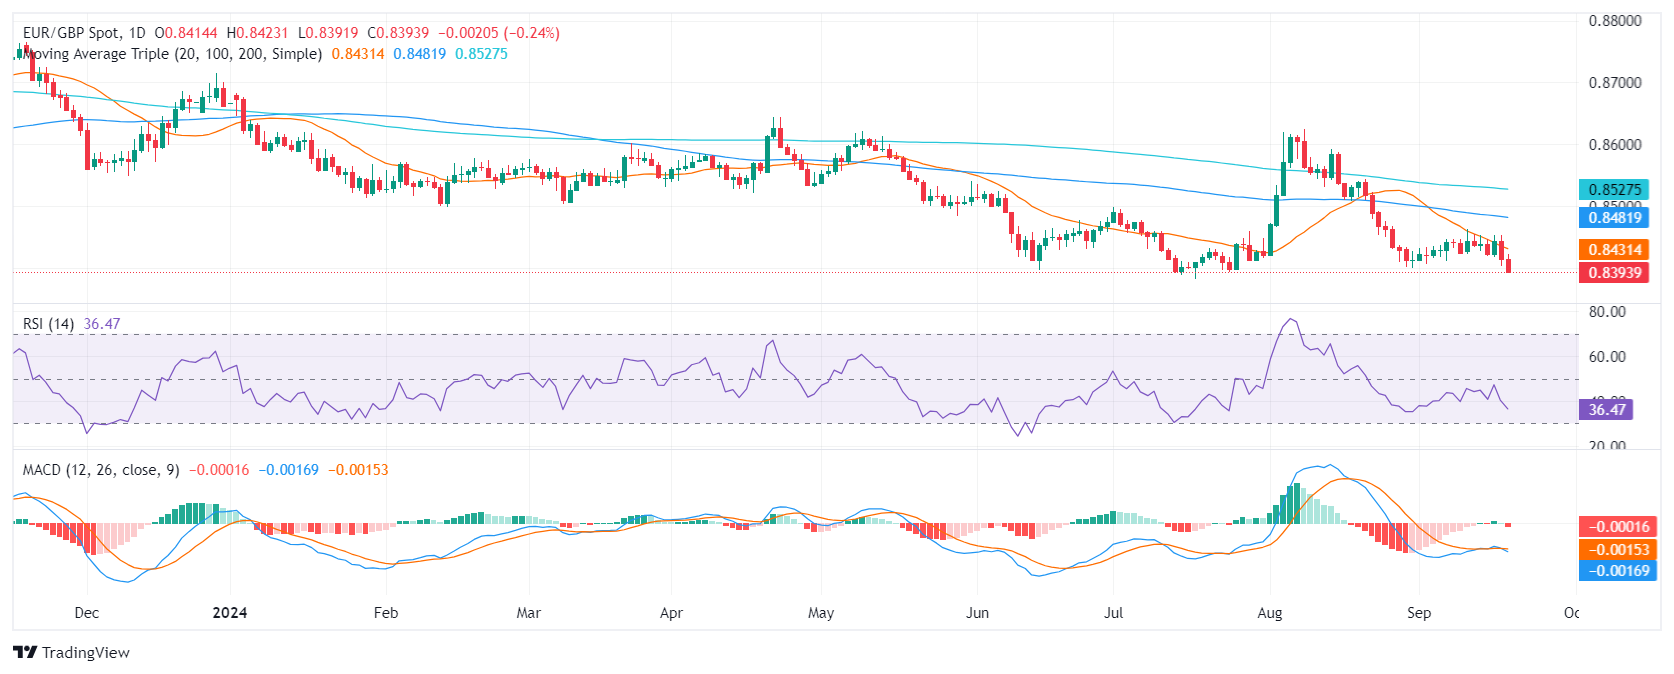
Based on the current technical picture, EUR/GBP is likely to continue trading lower and support levels can be found at 0.8380, 0.8350 and 0.8330. Resistance levels can be found at 0.8430 (20-day SMA), 0.8450 and 0.8500. 0.8380 is a strong support which, if broken, would mark a low from 2022 and confirm a negative outlook for the pair.
Source: Fx Street
I am Joshua Winder, a senior-level journalist and editor at World Stock Market. I specialize in covering news related to the stock market and economic trends. With more than 8 years of experience in this field, I have become an expert in financial reporting.


