
- EUR/GBP bounced off the 50 day EMA as buyers eye 0.8800.
- Favorable political news out of the UK briefly underpinned the pound sterling, though it retreated as the euphoria faded.
- In the short term, the EUR/GBP could correct towards 0.8700 before resuming its uptrend.
The EUR/GBP It retakes the 50 day EMA and is moving steadily towards 0.8750, although it is facing resistance from the 20 day EMA around 0.8751, while heading towards 0.8800, amid some political stability in the UK. The news that Rishi Sunak is the new head of the Conservative Party and therefore the new Prime Minister calmed the markets, although the British pound weakened. At time of writing, EUR/GBP is trading around 0.8746, above its opening price, up 0.27%.
EUR/GBP Price Forecast: Technical Outlook
From the point of view of the daily chart, the EUR/GBP continues to have a neutral bias. However, once it breaks above the 20-day EMA, it could send the pair looking towards 0.8800, before the next supply zone, the 12th Oct high at 0.8866, followed by the 0.8900 figure. It is noteworthy that the slope of the Relative Strength Index (RSI) moved up, which means that the buyers are gaining momentum, preparing to attack 0.8800.
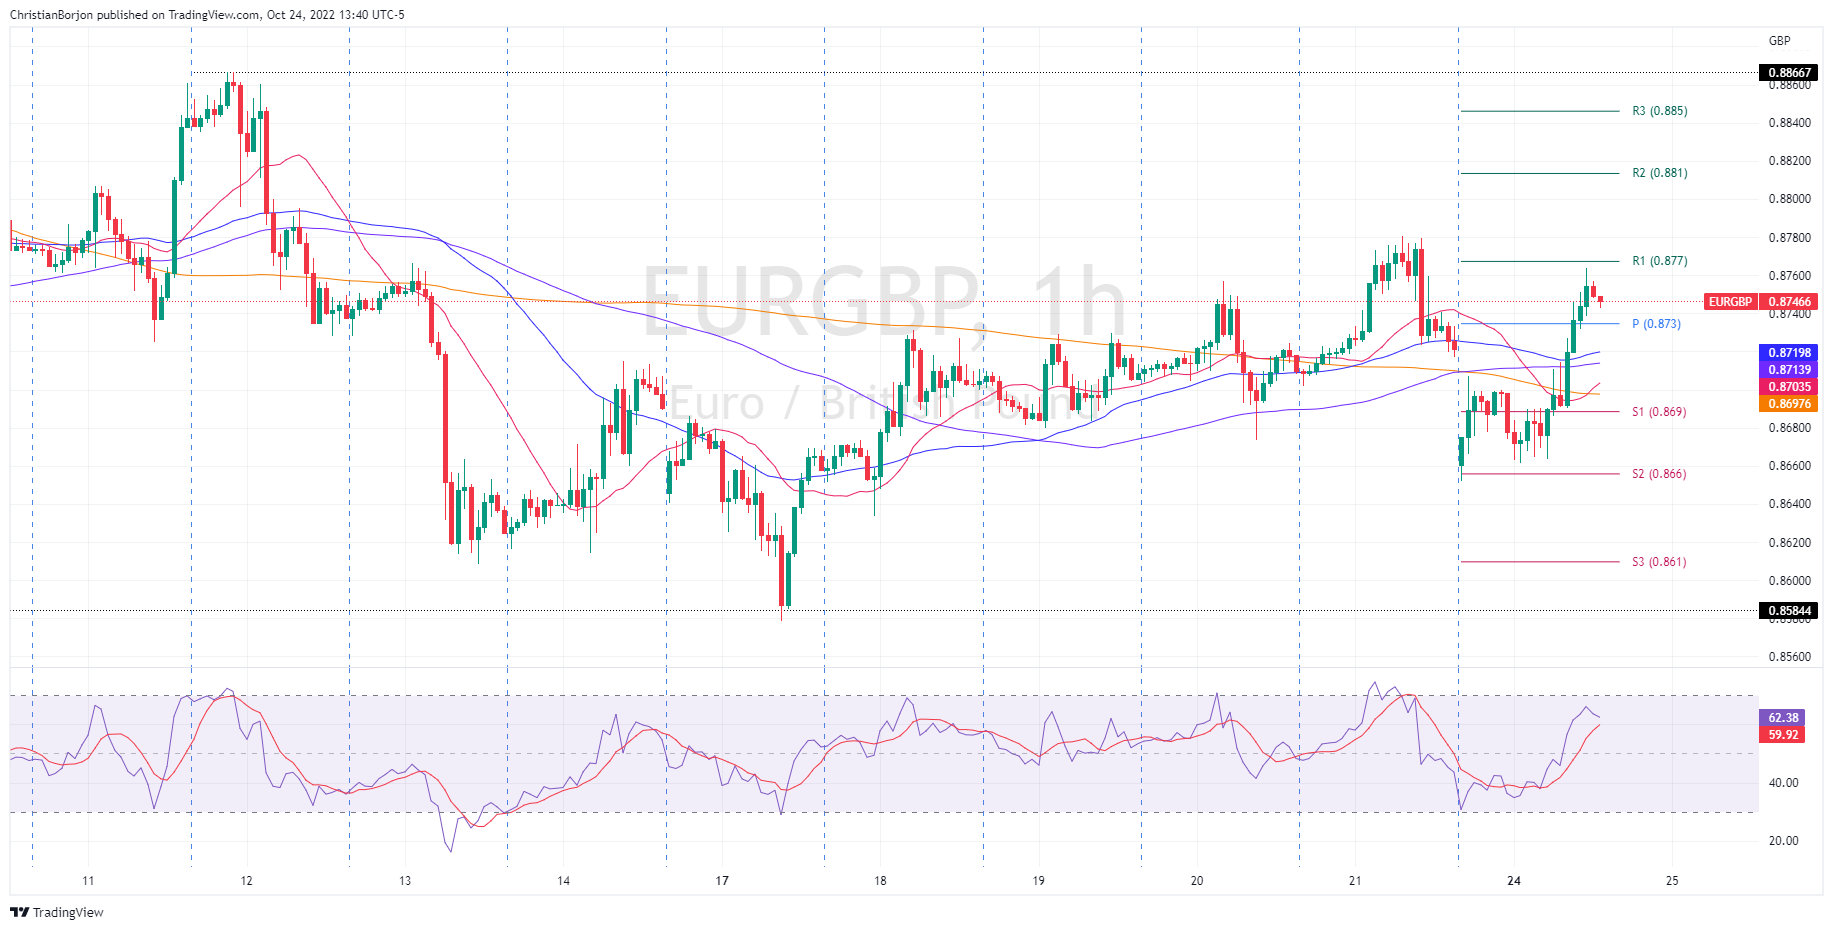
In the short term, the EUR/GBP hourly chart shows that the pair has gapped lower after the positive news from the UK, opening around 0.8660. The Euro later recovered from its earlier losses and retraced the 0.8700 mark as EUR/GBP headed towards the daily high of 0.8763 before the pair pulled back to current exchange rates in sympathy with the EUR/GBP Index. Relative Strength (RSI), which pointed to the downside.
Given the background, the first support for the EUR/GBP would be the confluence of the 50 and 100 EMAs around 0.8719/13. A break below will expose the 20 EMA at 0.8703, followed by the 200 EMA at 0.8697, before the S1 daily pivot at 0.8693.
EUR/GBP Key Technical Levels
Source: Fx Street
With 6 years of experience, I bring to the table captivating and informative writing in the world news category. My expertise covers a range of industries, including tourism, technology, forex and stocks. From brief social media posts to in-depth articles, I am dedicated to creating compelling content for various platforms.


