
- The EUR/GBP pair is hovering around 0.8710, thanks to a risk aversion impulse that strengthens the euro.
- The currency pair remains trapped inside the 20/50 day EMA.
- A bearish arc is forming on the daily chart of the EUR/GBP, which justifies further decline.
The euro continued gains against the British pound amid a volatile trading session in which both currencies were informed that inflation in the Eurozone and the UK remains higher, meaning more action is needed from central banks to control stubbornly high inflation. From a technical point of view, the EUR/GBP is trading 0.16% above its opening price, hovering around 0.8710, caught between the 20 and 50 day EMAs.
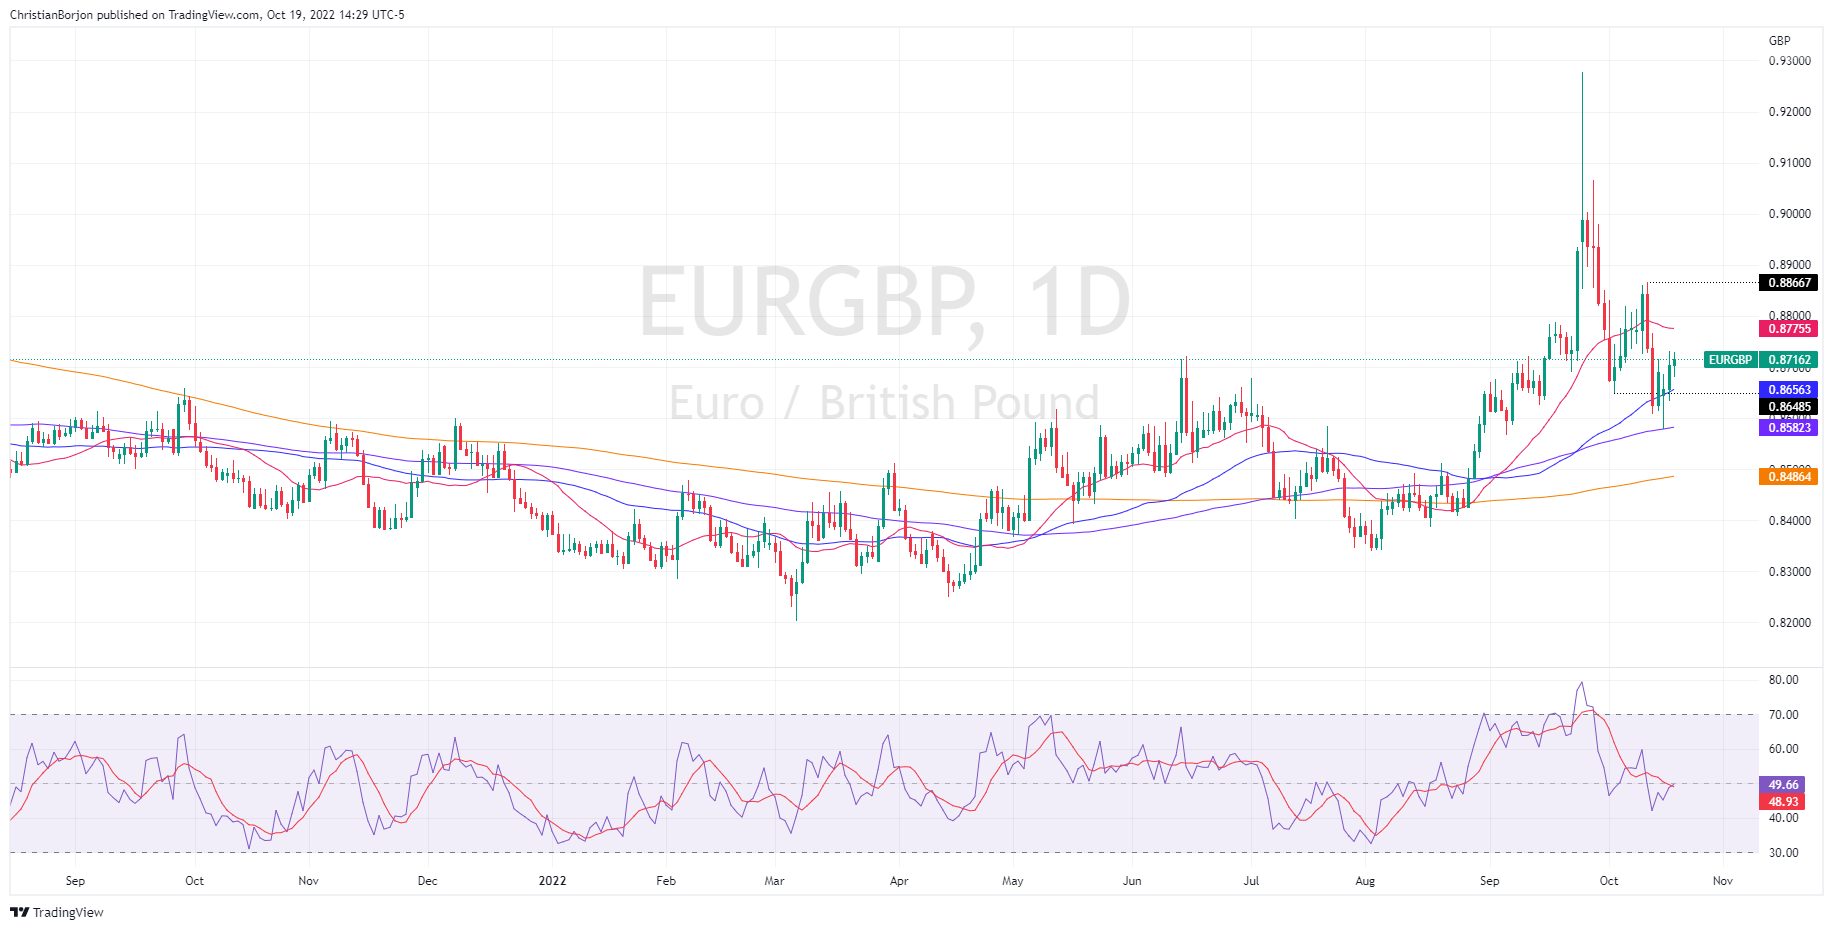
EUR/GBP Price Forecast
The EUR/GBP daily chart shows the pair with a neutral to bullish bias, although contained within last Tuesday’s price action (0.8633-0.8731). If the EUR/GBP breaks the Oct 18 high at 0.8731, that could pave the way for further gains, exposing the 20-day EMA at 0.8775. Otherwise, a bearish candlestick pattern would ensue, justifying bearish action on the pair. In this case, the key support for the EUR/GBP is the 50-day EMA at 0.8656, followed by the confluence of the Oct 17 low with the 50-day EMA at 0.8656/57.
EUR/GBP Daily Chart
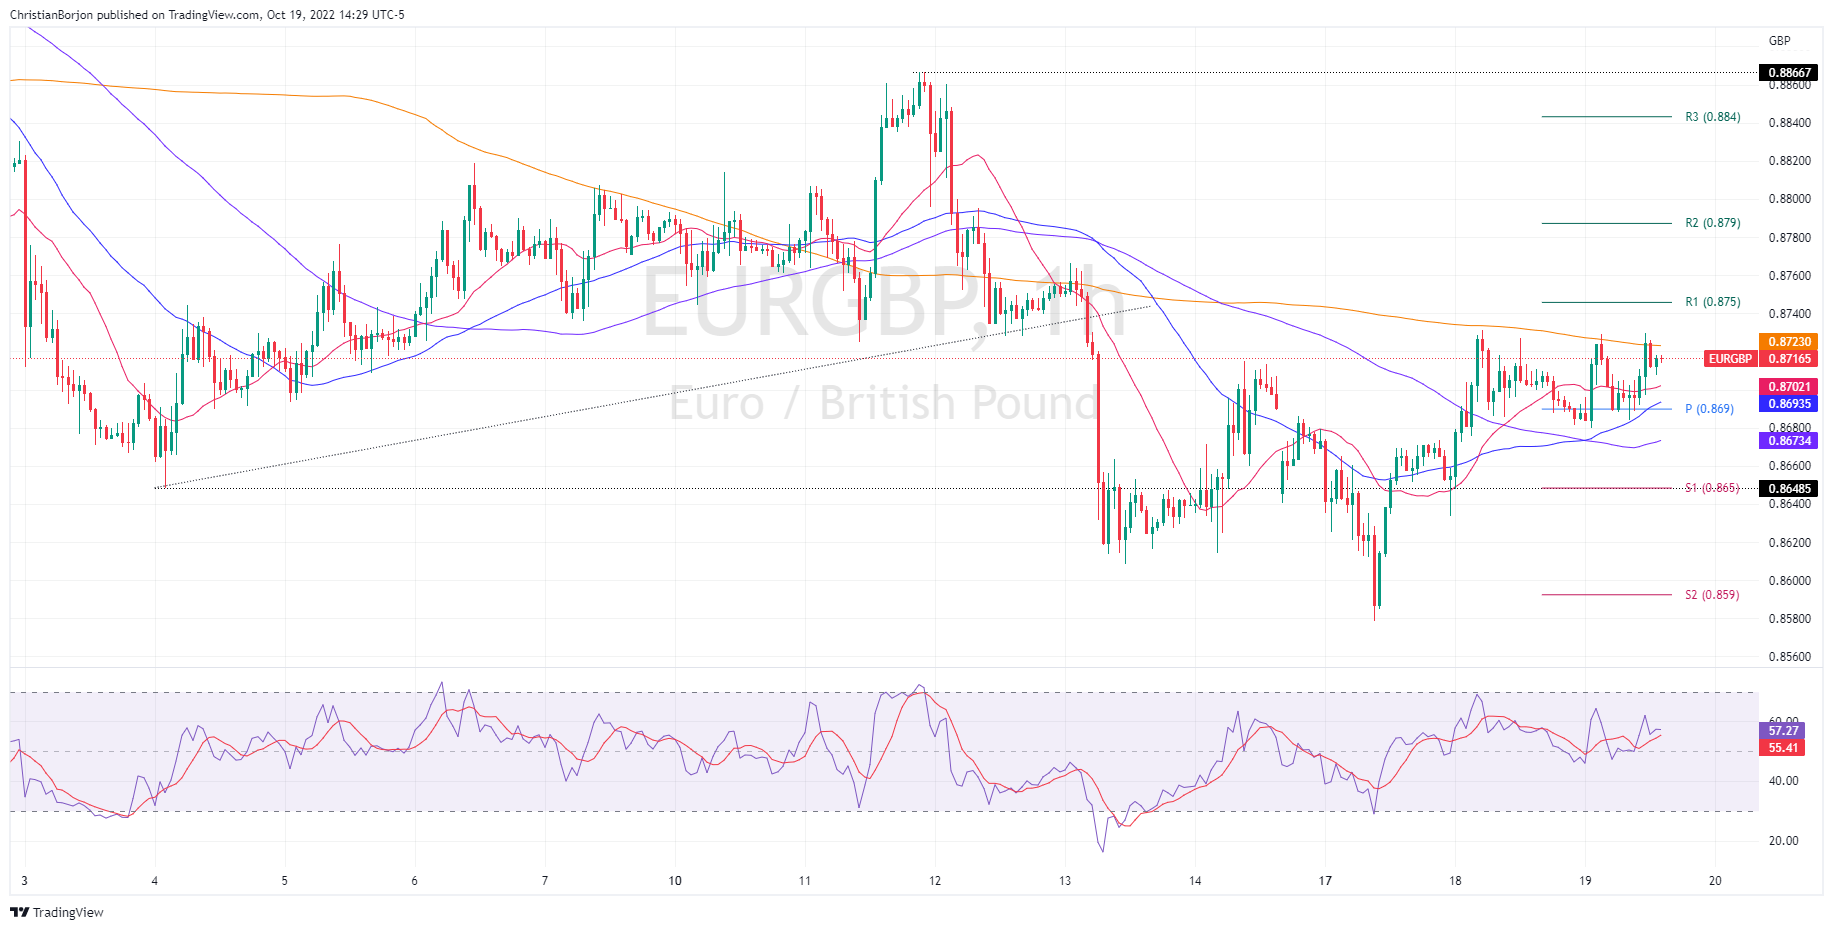
In the short term, the EUR/GBP one hour chart shows the pair as neutral, consolidating in the 0.8700-0.8723 area. Above, the 200 EMA at 0.8723 would be a difficult hurdle to overcome. Once breached, it could send EUR/GBP towards the R1 daily pivot at 0.8745, followed by the R2 pivot point at 0.8787, before the 0.8800 figure.
On the other hand, if EUR/GBP fails to break above 0.8731, the weekly high, it would deepen the slide towards new weekly lows. Therefore, the first support for the EUR/GBP will be the 20-EMA at 0.8702, followed by the confluence of the daily pivot and the 50-EMA at 0.8690. If it breaks below, the 100 EMA will be seen at 0.8673, followed by the S1 pivot level at 0.8650.
EUR/GBP hourly chart
Source: Fx Street
With 6 years of experience, I bring to the table captivating and informative writing in the world news category. My expertise covers a range of industries, including tourism, technology, forex and stocks. From brief social media posts to in-depth articles, I am dedicated to creating compelling content for various platforms.


