
- EUR/GBP has broken lower and extended its bearish trend on Tuesday.
- The RSI shows a lack of bearish momentum accompanying the move and is converging with the price.
EUR/GBP breaks lower after a brief pullback and continues its broader downtrend on Tuesday.
EUR/GBP 4-hour chart
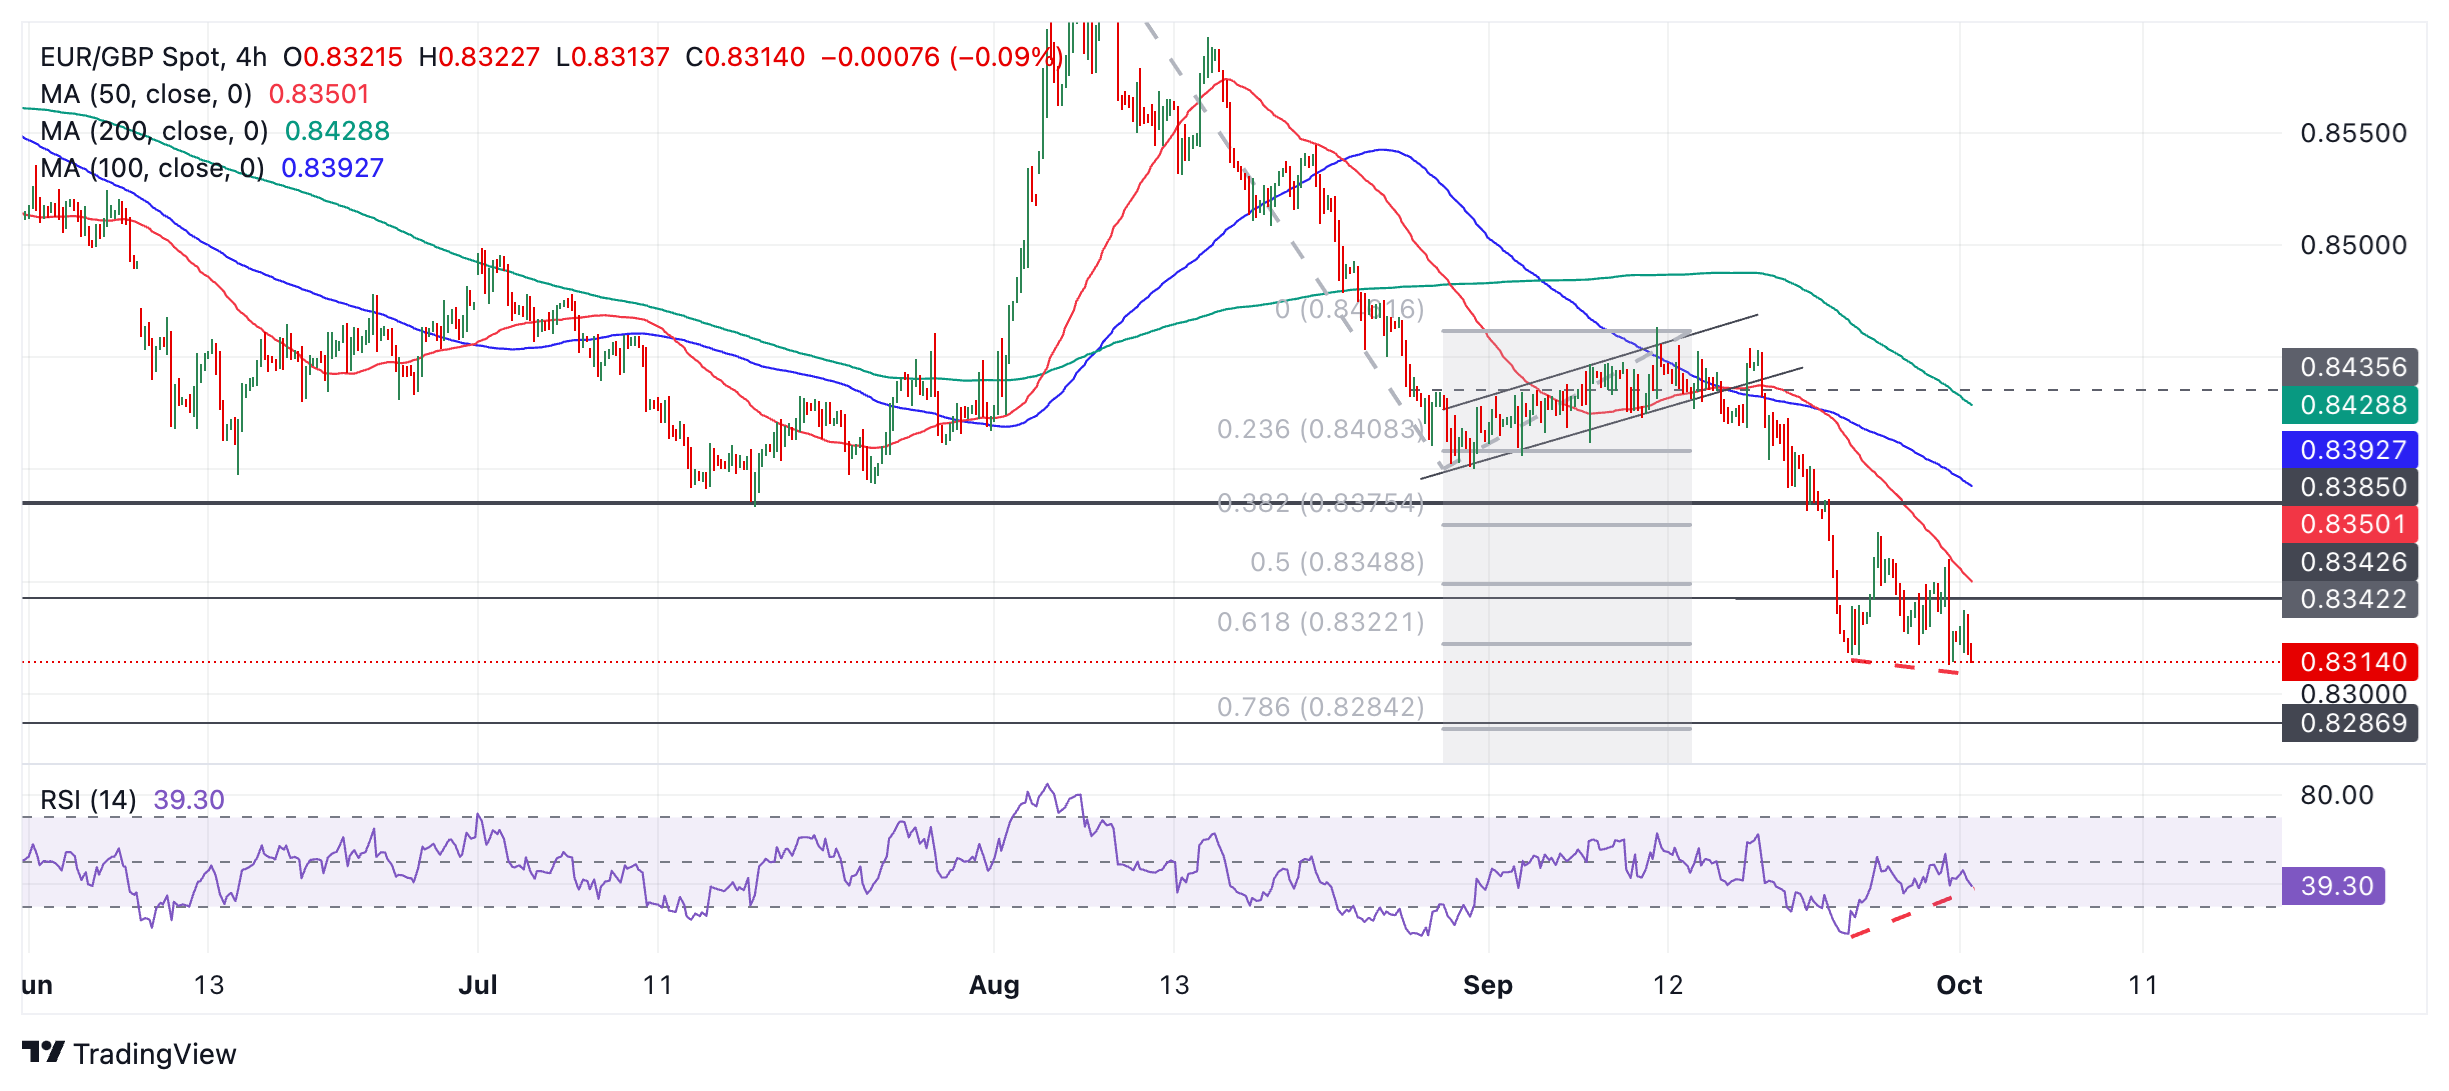
The pair breaks below the September 24 low at 0.8317, confirming an extension of the downtrend towards the next target at 0.8287, the August 2022 low.
The Relative Strength Index (RSI) is bullishly converging with the price when comparing the September 24 low with the current low (dashed red lines on the chart). Although the current low is below that of September 24, the RSI is not. This non-confirmation means that a lack of bearish momentum accompanies the current sell-off and could be a sign that it will soon run out.
EUR/GBP has already reached the first bearish target of the move that started at the August 5 high, at 0.8322. This is the extrapolation of the 61.8% August sell-off before the shallow channel formed in early September. Therefore, a further decline beyond the target could be a sign of overextension.
Source: Fx Street
I am Joshua Winder, a senior-level journalist and editor at World Stock Market. I specialize in covering news related to the stock market and economic trends. With more than 8 years of experience in this field, I have become an expert in financial reporting.


