
- EUR/GBP fluctuates within a range of 30 pips, remains above 0.8400 with a minor increase of 0.02%.
- The British Pound faces pressure as the decline in China’s manufacturing PMI favors the Euro’s gains.
- The technical outlook suggests potential for consolidation; key resistance at 200-day SMA of 0.8422.
EUR/GBP remains firm during the North American session after swinging in a 30 pip range, although buyers reclaimed the 0.8400 figure for a small 0.02% gain
Market sentiment remains negative, amid news that China’s business activity worsened in January according to the National Bureau of Statistics (NBS) Manufacturing PMI. This weighed on the Pound Sterling, which weakened against the single currency.
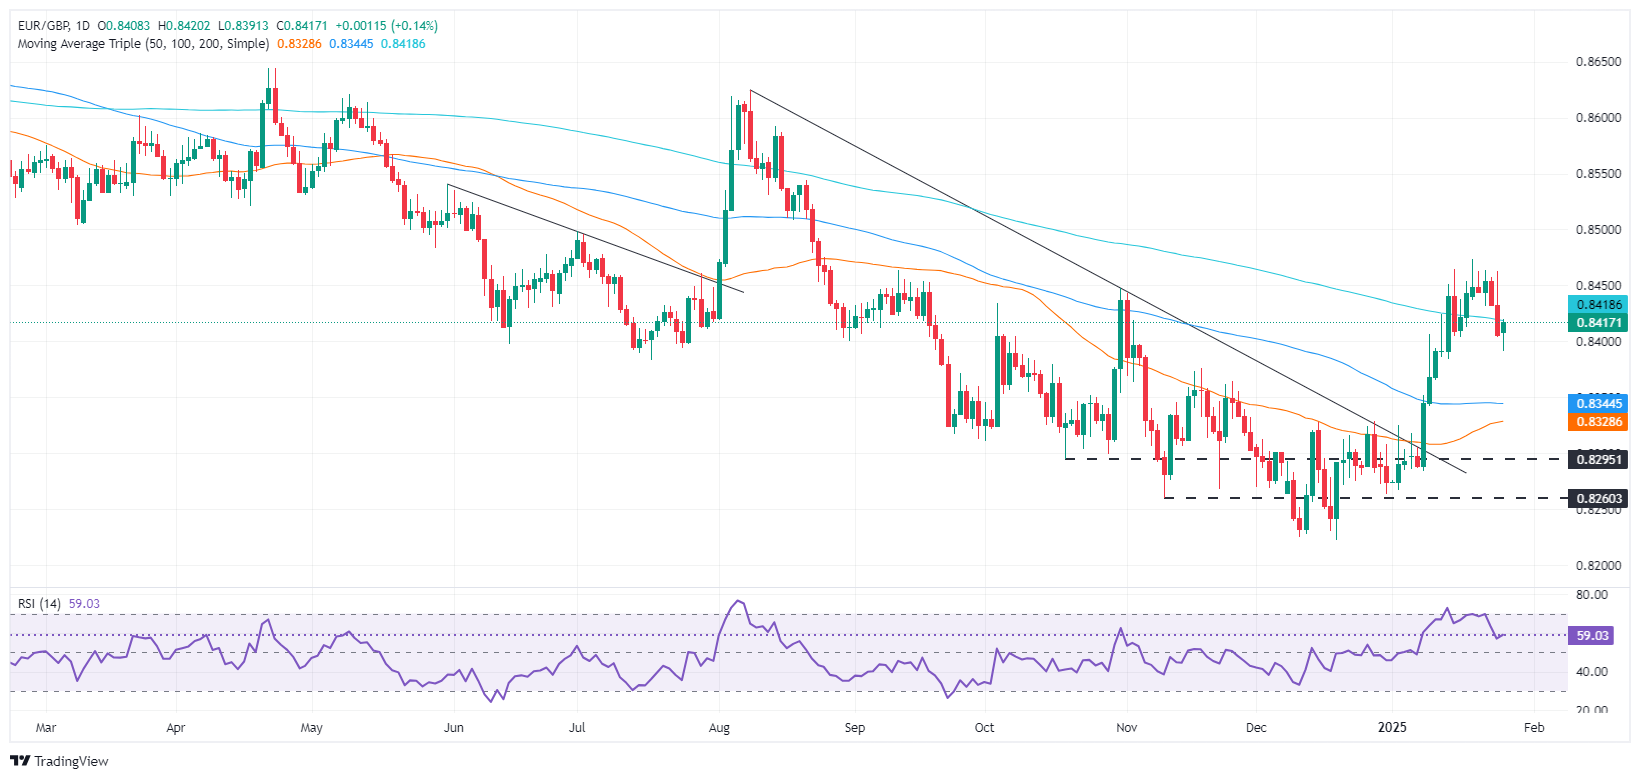
EUR/GBP Price Forecast: Technical Outlook
EUR/GBP has extended its losses below the 200-day SMA at 0.8422, opening the door to test lower prices, but the bulls are intervening around the 0.8400 figure.
The Relative Strength Index (RSI) is bullish, although it has flattened, an indication that the cross could consolidate before resuming its ongoing uptrend.
For a bullish continuation, buyers must surpass the 200-day SMA. If broken, the next stop will be the January 24 daily high at 0.8462, before the next cycle high at 0.8473, the January 20 peak.
On the other hand, if sellers push prices below the 0.8400 figure, the next support would be the last pivot low of 0.8383, the January 14 low, followed by the 100-day SMA at 0.8347.
EUR/GBP Price Chart – Daily
Euro PRICE Today
The table below shows the percentage change of the Euro (EUR) against the main currencies today. Euro was the strongest currency against the New Zealand Dollar.
| USD | EUR | GBP | JPY | CAD | AUD | NZD | CHF | |
|---|---|---|---|---|---|---|---|---|
| USD | -0.03% | 0.07% | -0.68% | 0.20% | 0.58% | 0.48% | -0.48% | |
| EUR | 0.03% | 0.17% | -0.54% | 0.37% | 0.62% | 0.63% | -0.35% | |
| GBP | -0.07% | -0.17% | -1.00% | 0.20% | 0.45% | 0.48% | -0.51% | |
| JPY | 0.68% | 0.54% | 1.00% | 0.94% | 1.46% | 1.41% | 0.36% | |
| CAD | -0.20% | -0.37% | -0.20% | -0.94% | 0.18% | 0.28% | -0.71% | |
| AUD | -0.58% | -0.62% | -0.45% | -1.46% | -0.18% | 0.05% | -0.92% | |
| NZD | -0.48% | -0.63% | -0.48% | -1.41% | -0.28% | -0.05% | -1.20% | |
| CHF | 0.48% | 0.35% | 0.51% | -0.36% | 0.71% | 0.92% | 1.20% |
The heat map shows percentage changes for major currencies. The base currency is selected from the left column, while the quote currency is selected from the top row. For example, if you choose the Euro from the left column and move along the horizontal line to the US Dollar, the percentage change shown in the box will represent EUR (base)/USD (quote).
Source: Fx Street
I am Joshua Winder, a senior-level journalist and editor at World Stock Market. I specialize in covering news related to the stock market and economic trends. With more than 8 years of experience in this field, I have become an expert in financial reporting.


